Figures & data
Table 1 Techniques for scoring visual movement
Table 2 Definitions of level of visual movement observed with measured periodic limb movements
Table 3 The age distribution of the 460 patients and the frequency of the identified PLMs
Table 4 Sex distribution of patients with PLMIs as percent of each index level
Figure 1 The observed level of movement in the entire group of patients with periodic limb movements.
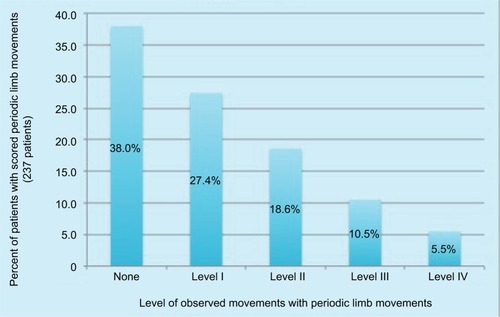
Table 5 The PLMI measured and the observed movements for the entire population
Table 6 Relationship between AHI and PLMI
Table 7 The level of observed movements in patients without apnea
Table 8 The level of observed movements in patients with obstructive sleep apnea
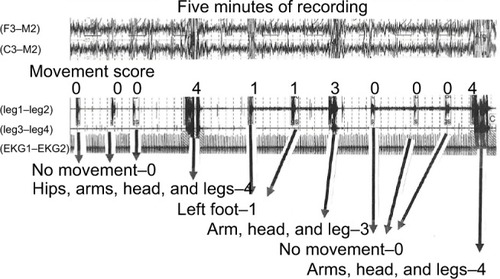
Figure 2 This is an example of the variations in the observed level of identified in some individuals.