
Figures & data
Figure 1 Measurements of morning blood pressure surge (MBPS).
Notes: Sleep-trough MBPS definition: mean blood pressure in the 2 hours following morning awakening – lowest nocturnal blood pressure (measured as the mean of three measurements centered on the lowest nocturnal value). Prewaking MBPS definition: mean blood pressure in the 2 hours following morning awakening – mean blood pressure in the 2 hours preceding morning awakening. Copyright ©2003. American Heart Association, Inc. Reproduced from Kario K, Pickering TG, Umeda Y, et al. Morning surge in blood pressure as a predictor of silent and clinical cerebrovascular disease in elderly hypertensives: a prospective study. Circulation. 2003;107(10):1401–1406 (https://www.ahajournals.org/doi/10.1161/01.cir.0000056521.67546.aa).Citation29
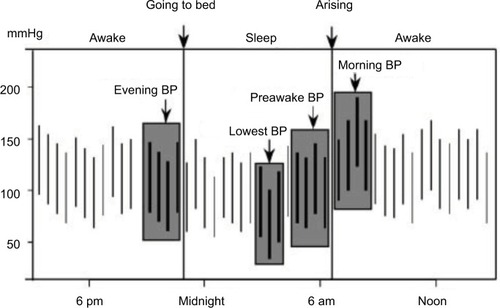
Figure 2 Different blood-pressure profiles in two subjects with high sleep-trough morning blood pressure surge (MBPS).
Notes: High MBPS may or may not be associated with low nocturnal blood pressure. Copyright ©2005. American Journal of Hypertension, Ltd. Reproduced from Kario K. Time for focus on morning hypertension: pitfall of current antihypertensive medication. Am J Hypertens. 2005;18(2 Pt 1):149–151, by permission of Oxford University Press.Citation35
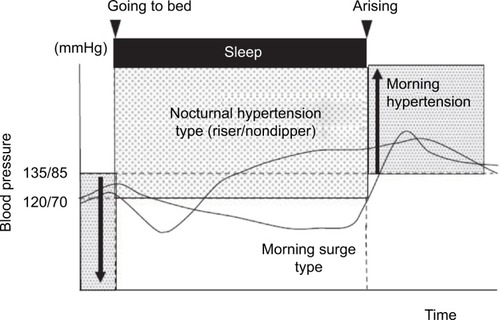
Figure 3 Means ± SD of (A) ΔPs and (B) ΔPd values in control (□) and obstructive sleep apnea (◊) subjects for each sampling interval.
Notes: ΔPs and ΔPd: differences in mmHg between the mean nocturnal blood pressure values, respectively systolic and diastolic, obtained from sampled single heart beats and from all heart beats. Copyright ©2000. ERS Journals Ltd. Reproduced from Marrone O, Romano S, Insalaco G, Bonsignore MR, Salvaggio A, Bonsignore G. Influence of sampling interval on the evaluation of nocturnal blood pressure in subjects with and without obstructive sleep apnoea. Eur Respir J. 2000;16(4):653–658.Citation53
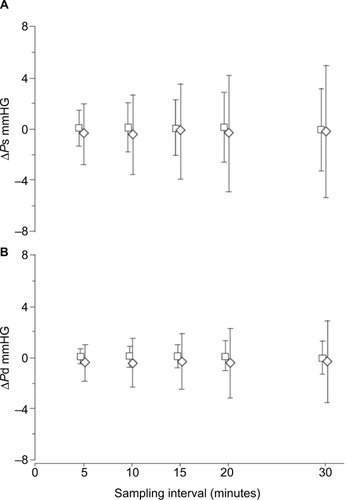
Figure 4 Fragment of a polygraph recording in a representative sleepy patient with severe obstructive sleep apnea.
Notes: Patient undergoing simultaneous continuous finger blood pressure monitoring and ambulatory blood pressure monitoring (ABPM). Top to bottom: pressure detected by an open hose placed under the cuff for ABPM measurements; beat-by-beat blood pressure (BP); nasal airflow; oxyhemoglobin saturation (SaO2). A flat airflow signal identifies apnea time. In this patient, apnea duration was similar before and during ABPM measurement, which indicates that the cuff inflation did not cause any arousal shortening habitual apnea duration. ABPM measurement required a time exceeding the duration of an apnea cycle, ie, of an apnea and following ventilation. During that period, BP values largely varied, but only one systolic and one diastolic value were obtained by ABPM.
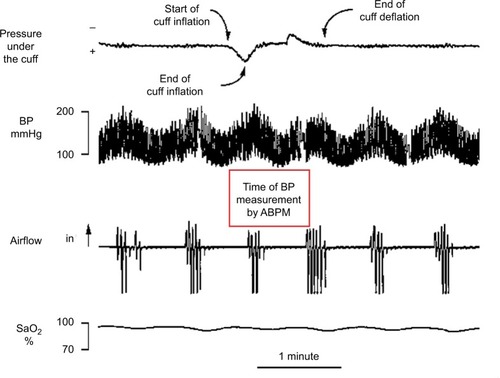
Table 1 Studies based on morning and evening BP measurements
Table 2 24-Hour BP characteristics in obstructive sleep apnea: beyond dipping and nondipping
Table 3 Changes in BP variability associated with CPAP treatment