
Figures & data
Table 1 Descriptive characteristics of the study population
Table 2 mean ± SD/median (interquartile range) values for PSG and actigraphy of total sleep time, wake after sleep onset, and sleep efficiency
Table 3 Mean differences and intraclass correlation coefficients between PSG and actigraphy
Figure 1 Bland–Altman plots of GT3X+ and AWS in 22 adults for (A) total sleep time: GT3X+: CK versus AWS, (B) WASO: GT3X+: CK versus AWS, (C) total sleep time: GT3X+: Sadeh versus AWS, and (D) WASO: GT3X+: Sadeh versus AWS. The dotted line indicates the mean of the differences or bias, and the dashed lines indicate the lower and upper 95% limits of agreement.
Abbreviations: AWS, Actiwatch Spectrum; CK, Cole–Kripke; WASO, wake after sleep onset.
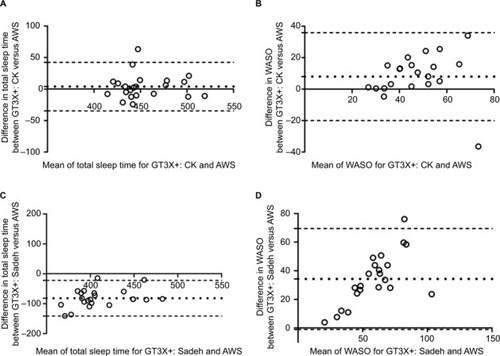
Table 4 Sensitivity, specificity, and accuracy of epoch-by-epoch comparisons with PSG