Figures & data
Figure 1 Examples of HR patterns from clinical PSGs.
Abbreviations: AHI, apnea–hypopnea index; BMI, body mass index; HR, heart rate; NREM, nonrapid eye movement; OSA, obstructive sleep apnea; PLM, periodic limb movements; PLMS, periodic limb movements in sleep; PSG, polysomnography; REM, rapid eye movement; RLS, restless legs syndrome; SDB, sleep-disordered breathing.
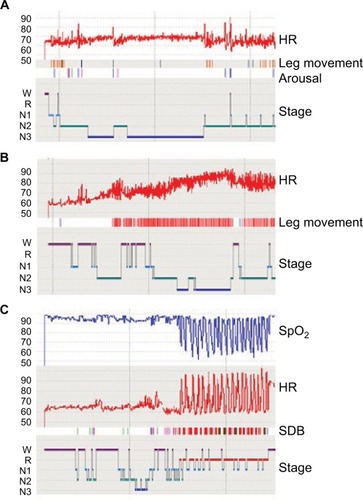
Table 1 Characteristics of the full cohort and clinically defined subsets
Figure 2 HR analysis across sleep–wake stages.
Abbreviations: HR, heart rate; PSG, polysomnography; REM, rapid eye movement.
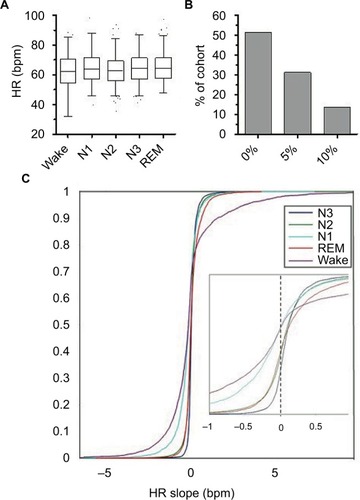
Table 2 HRV correlations with selected clinical features
Figure 3 Clinical, PSG, and cardiac correlates of PLMS.
Abbreviations: HF, high frequency; HR, heart rate; HTN, hypertension; LF, low frequency; MP, misperception; PLM, periodic limb movements; PLMS, periodic limb movements in sleep; PLMI, periodic limb movement index; PSG, polysomnography; REM, rapid eye movement; TST, total sleep time; WHR, wake heart rate.
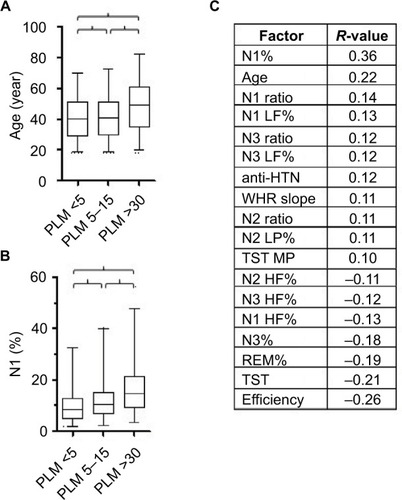
Figure 4 Clinical, PSG, and cardiac correlates of sleep quality and of misperception. Notes: (A) Box and whiskers plot showing the distribution of sleep efficiency (%) for prespecified categories of sleep quality. Bracket indicates significance (Mann–Whitney, P<0.003). (B) Box and whiskers plot showing the distribution of misperception of TST (subjective minus objective TST, in minutes) for prespecified categories of sleep quality. Bracket indicates significance (Mann–Whitney, P<0.0001). (C) Correlation coefficients reaching the predefined minimum value of |>0.1|, with the sleep quality value across the cohort. The P-values are all <0.005. (D) Correlation coefficients reaching the predefined minimum value of |>0.1|, with the TST misperception value across the cohort. The P-values are all <0.005.
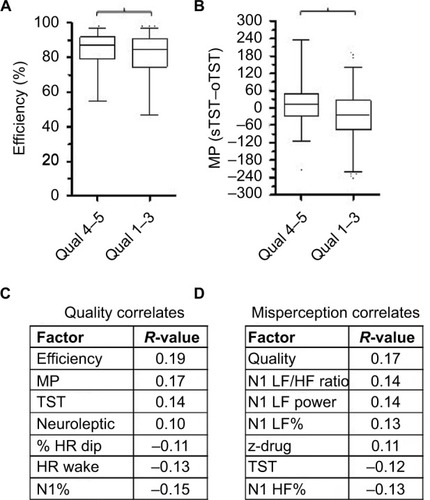
Figure 5 Insomnia symptoms and objective TST.
Abbreviations: HR, heart rate; Ins, insomnia; L, long; PLMI, periodic limb movements index; PSG, polysomnography; REM, rapid eye movement; S, short; TST, total sleep time
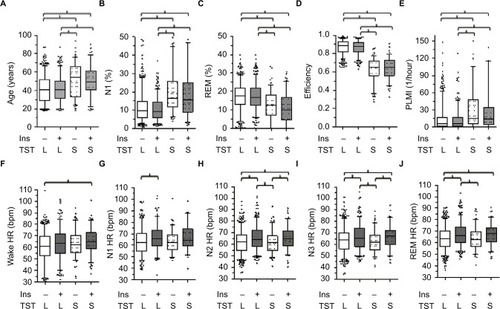
Table 3 Objective short TST with insomnia symptoms
Figure S1 Examples of HR slope assessments from clinical PSGs.
Notes: In (A) and (B), the scored hypnogram is shown above the HR tracing derived from the pulse oximetry signal as visualized through the Grass software. The HR units (Y-axis) are in beats per minute. The color scheme of the stages is the same as in of the main text. Stages are indicated on the Y-axis. Time base is given for an 1 hour increment (and hash marks on the X-axis are 30 minutes apart). For each sleep–wake stage bout of 35 minutes (“stable” bouts), the calculated best fit line is super-imposed on the HR trace (black lines).
Abbreviations: HR, heart rate; PSGs, polysomnography; REM, rapid eye movement; W, wake.
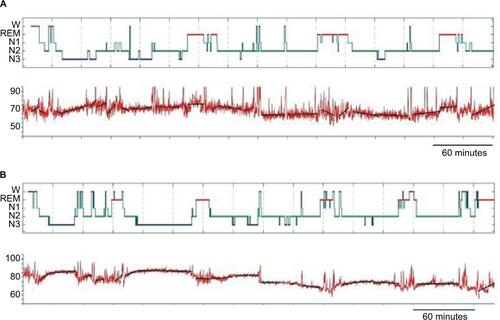
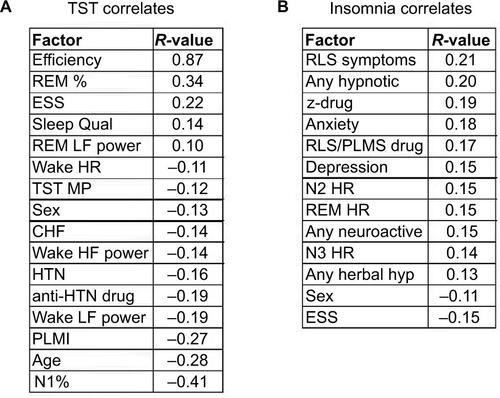
Figure S2 Correlations with TST and with insomnia symptoms.
Notes: (A) Significant correlations above the prespecified minimum of >|0.1| for the PSG-derived TST value. (B) Significant correlations above the prespecified minimum of >|0.1| for insomnia symptoms (“Methods” section).
Abbreviations: CHF, congestive heart failure; ESS, Epworth Sleepiness Scale; HF, high frequency; HR, heart rate; HRV, HR variability; HTN, hypertension; hyp, hypnotic; LF, low frequency; MP, misperception; PLMI, periodic limb movement index; PLMS, periodic limb movements in sleep; PSG, polysomnography; Qual, quality; REM, rapid eye movement; RLS, restless legs syndrome; TST, total sleep time; z-drug, zolpidem, zaleplon, eszopiclone.