Figures & data
Table 1 Primers sequences for real-time (quantitative) RT-PCR assays of rat mRNA samples
Table 2 Effects of dexamethasone treatment on final body weight, the percentage of periepididymal fat pad, glycemia, insulin and HOMA. Eight rats were examined for each group
Figure 1 L/D glucose cycle profile of control rats (lines with circles) and treated with dexamethasone (lines with squares).
Abbreviations: ANOVA, analysis of variance; DEX, dexamethasone; L/D, light/dark; ZT, Zeitgeber time.
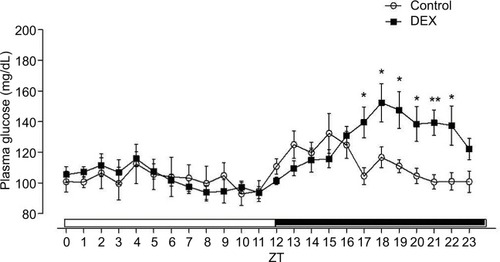
Figure 2 Plasma insulin profile in control rats (white bar) and rats treated with dexamethasone (black bars).
Abbreviations: ANOVA, analysis of variance; DEX, dexamethasone; ZT, Zeitgeber time.
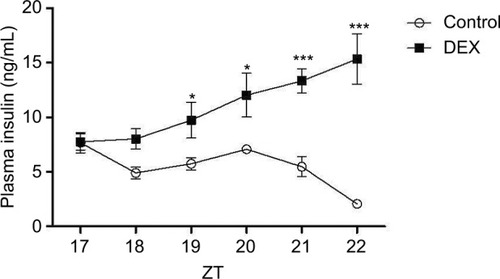
Figure 3 (A) Evaluation of plasma glucose during the glucose tolerance test. Blood samples were collected from control and dexamethasone-treated rats at ZT2 at baseline (0 min) and at 1, 5, 20, and 50 min after glucose injection. The results are represented as mean ± SEM. Two-way ANOVA, Bonferroni’s post-tests *P<0.05, **P<0.01, ***P<0.001 (n=8 for both groups). (B) Evaluation of plasma glucose during the insulin tolerance test (KITT). Glucose was measured in control rats and rats treated with dexamethasone at ZT2 (0 min) and at 4, 8, 12, and 16 min after insulin injection. Student’s t-test #P<0.05.
Abbreviations: ANOVA, analysis of variance; DEX, dexamethasone; ZT, Zeitgeber time.
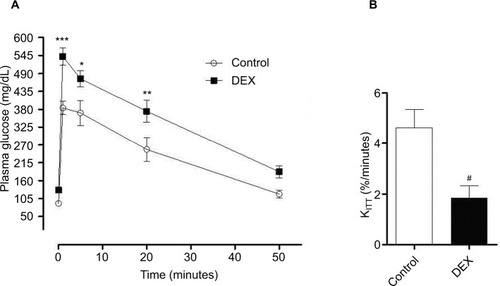
Figure 4 AANAT activity, melatonin content, and plasma level of corticosterone were evaluated in Control and dexamethasone-treated rats (lines graph with circles and squares for Control and dexamethasone-treated rats, respectively).
Abbreviations: AANAT, Arylalkylamine N-acetyltransferase; DEX, dexamethasone; ZT, Zeitgeber time.
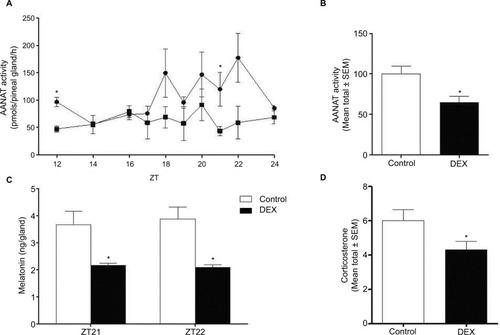
Figure 5 Expression of Tph, Hiomt, Aanat, AC1, and B-adrenergic receptor in pineal glands isolated from control (line graph with circles) and treated with dexamethasone rats (line graph with squares).
Abbreviations: AANAT, Arylalkylamine N-acetyltransferase; AC1, Adenylate cyclase; ANOVA, analysis of variance; ZT, Zeitgeber time.
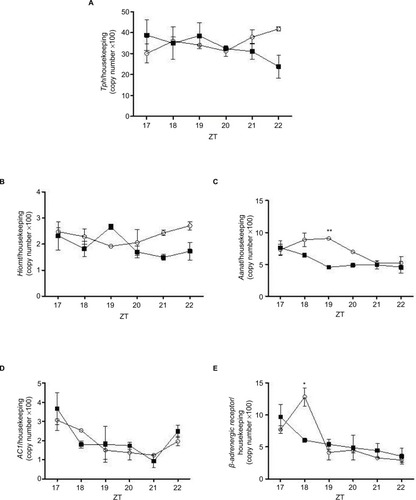
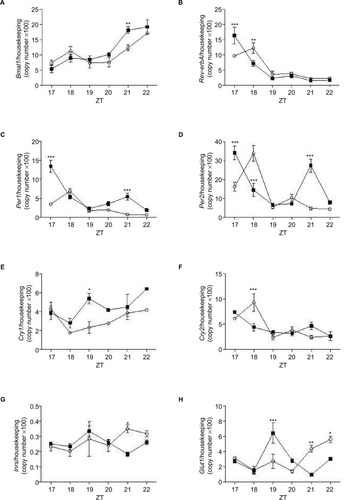
Figure 6 Expression of Bmal1, Rev-erbA, Per1, Per2, Cry1, Cry2, Inrs, and Glut1 in pineal glands isolated from control (white bar) and treated with dexamethasone rats (filled bars).
Abbreviations: ANOVA, analysis of variance; ZT, Zeitgeber time.