Figures & data
Figure 1 Normal self-reported sleep durations in children aged 0–12 years.
Note: The mean reference values are from a meta-analysis of 34 studies from 18 countries.Citation44
Abbreviations: m, months; y, years.
Abbreviations: m, months; y, years.
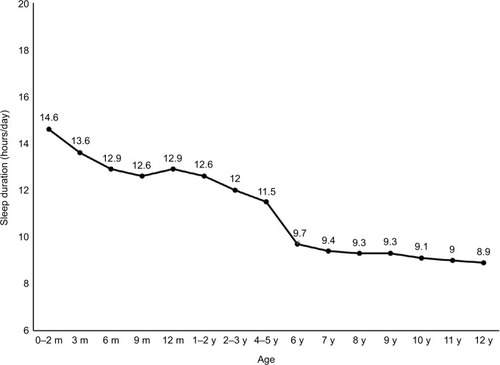
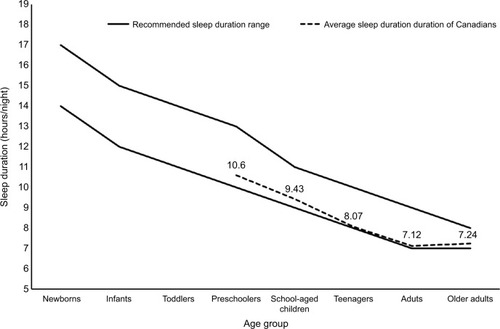
Figure 2 Normal actigraphy-determined sleep duration values in children aged 3–18 years.
Note: The mean reference values are from a meta-analysis of 79 studies from 17 countries.Citation45
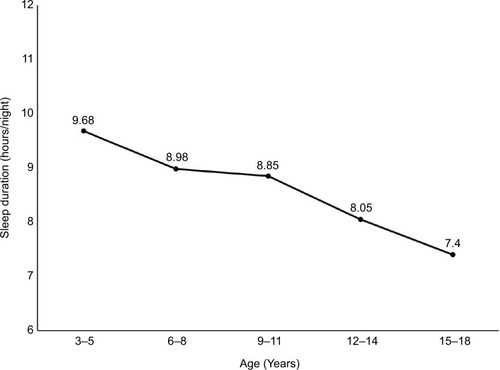
Table 1 Sleep duration recommendations in the US and Canada
Figure 3 Sleep duration estimates of Canadians (dashed line) compared with the sleep duration recommendation ranges (solid lines).
Notes: Sleep duration estimates for the Canadian population have been recently published.Citation65–Citation67 However, they are not available for newborns, infants, or toddlers. Canadians sleeping less than recommended for optimal health is estimated at 16% for preschoolers, 20% for school-aged children, 30% for teenagers, 32% for adults, and 31% for older adults.