
Figures & data
Table 1 Study population characteristics by diagnosis
Figure 1 Probability of moderate/severe OSA by CRP and HbA1c values in combination.
Notes: When CRP was ≥0.2 mg/dL and HbA1c ≥5.7%, the probability of moderate/severe OSA was 81%. When neither marker was elevated, the probability was 37%, which was less than half that observed when both markers are elevated.
Abbreviations: CRP, C-reactive protein; OSA, obstructive sleep apnea.
Abbreviations: CRP, C-reactive protein; OSA, obstructive sleep apnea.
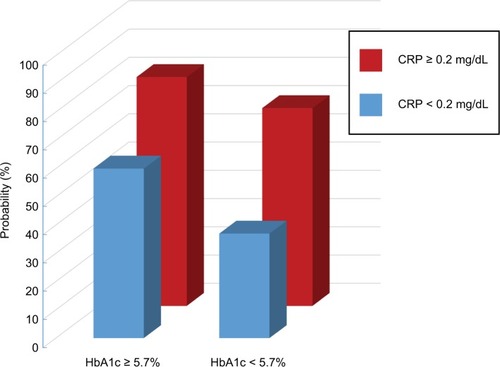
Table 2 Comparison of ROC AUCs for OSA: biomarkers and clinical measures
Figure 2 ROC curves for detection of OSA in non-obese subjects (BMI <30).
Notes: In non-obese subjects, the AUC for the combination of biomarkers (0.75) was higher than BMI (0.61), as well as the STOP-Bang (0.66) and ESS (0.56) scores.
Abbreviations: AUC, area under the curve; BMI, body mass index; BP, blood pressure; CRP, C-reactive protein; EPO, erythropoietin; ESS, Epworth Sleepiness Scale; FPF, false positive fraction; OSA, obstructive sleep apnea; ROC, receiver operating characteristic; TPF, true positive fraction.
Abbreviations: AUC, area under the curve; BMI, body mass index; BP, blood pressure; CRP, C-reactive protein; EPO, erythropoietin; ESS, Epworth Sleepiness Scale; FPF, false positive fraction; OSA, obstructive sleep apnea; ROC, receiver operating characteristic; TPF, true positive fraction.
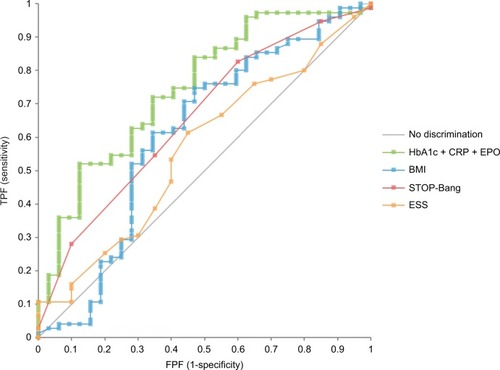
Table 3 Measures of diagnostic test performance for key parameters
Table S1 Full title of each ethical review board, and its affiliated institution