
Figures & data
Figure 1 Twenty-four h time courses in the fruit fly under four experimental conditions. Data of each of four experiments were averaged within and across four strains.
Abbreviations: SEM, standard error of mean; h, clock hour; DD, constant darkness.
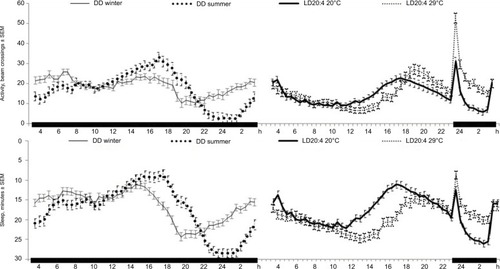
Figure 2 Twenty-four h time courses in four chronotypes under different lighting conditions. Data of experiments under constant darkness (DD) and long photoperiod (LD20:4) were averaged within each of four strains (G10, U28, G15, and F30). Upper and lower graphs: Locomotor activity and sleep, respectively. Left and right graphs: Exposure to DD and LD20:4, respectively.
Abbreviations: SEM, standard error of mean; h, clock hour; DD, constant darkness; EM, early morning; LM, late morning; MD, middle of the day; EE, early evening; LE, late evening; MN, middle of the night.
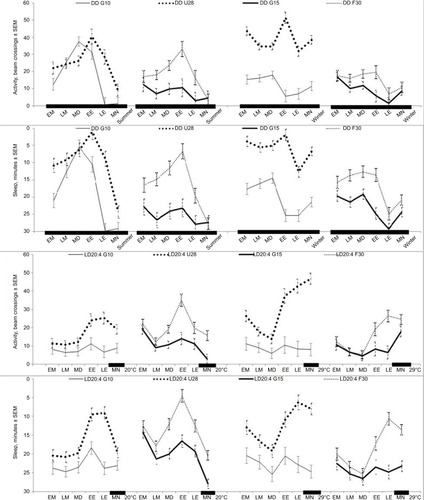
Figure 3 Twenty-four h time courses in four chronotypes at 20°C and 29°C. Data of flies from each of two experiments with exposure to long photoperiod were averaged within each of two strains (G10 and U28). Upper and lower graphs: Locomotor activity and sleep in G10 (left graphs) and U28 (right graphs) and in G15 (left graphs) and F30 (right graphs), respectively.
Abbreviations: SEM, Standard error of mean; h, clock hour.
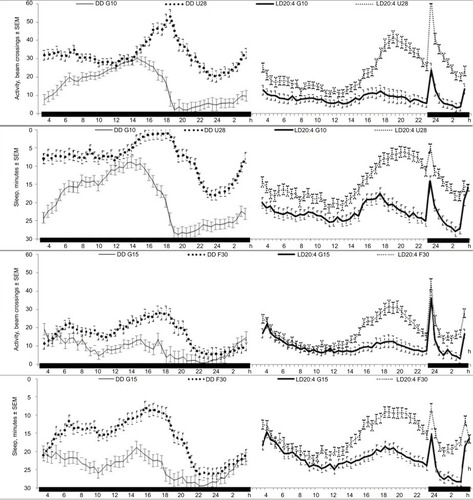
Table 1 Results of two-way rANOVAs with repeated measure “Time” and independent factor “Strain”
Table 2 Results of two-way rANOVAs with repeated measure “Time” and independent factor “Temperature”
Figure 4 Locomotor activity and sleep in four chronotypes under four experimental conditions. Data of each of four experiments under constant darkness (DD in summer and winter) and long photoperiod (LD20:4 at 20°C and at 29°C) were averaged within each of four strains (G10, U28, G15, and F30).
Abbreviations: SEM, standard error of mean; DD, constant darkness; EM, early morning (3:00–7:00); LM, late morning (7:00–11:00); MD, middle of the day (11:00–15:00); EE, early evening (15:00–19:00); LE, late evening (19:00–23:00); MN, middle of the night (23:00–3:00).
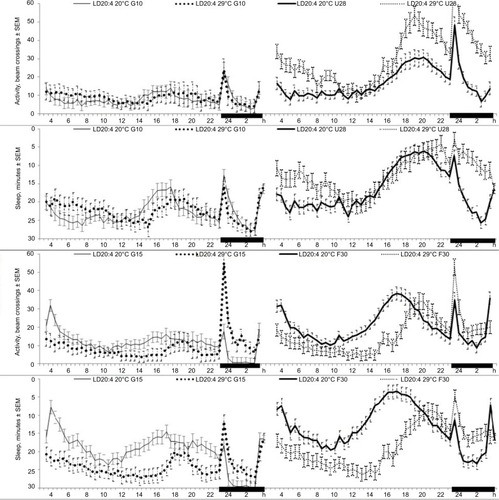
Table 3 Results of one-way MANOVAs with independent factor “Temperature”