Figures & data
Figure 1 The MSLT protocol.
Notes: Sleep duration in the prior night was estimated by asking the participants to log-in to a webpage every hour during the night and once when they woke up. Periods of naps during the sleep restriction visit are shown in orange, and periods of naps during the usual night sleep visit are shown in purple.
Abbreviation: MSLT, Multiple Sleep Latency Test; RT, reaction time.
Abbreviation: MSLT, Multiple Sleep Latency Test; RT, reaction time.
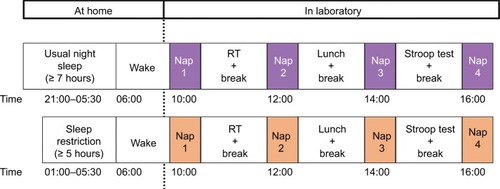
Figure 2 The in-ear EEG sensor.
Notes: (A) The hardware of the in-ear EEG and the sensor placement inside the external auditory meatus. The length and diameter are the measurements before the insertion. (B) A person wearing the scalp-EEG (C4) and in-ear EEG sensor with corresponding signals. The EEG shows a transition from alpha activity to theta activity during 10 seconds.
Abbreviations: EEG, electroencephalography; GND, ground.
Abbreviations: EEG, electroencephalography; GND, ground.
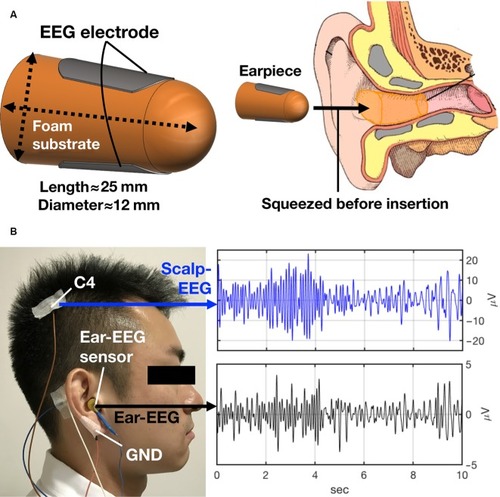
Figure 3 Consort flowchart.
Notes: (A) Consort diagram of the recruitment. (B) Details of the naps excluded from the analysis: participant number, visits (first or second visit), sleep restriction (orange box) and usual night sleep (purple box) and nap numbers. Disconnection means that the electrodes did not record data due to technical problems.
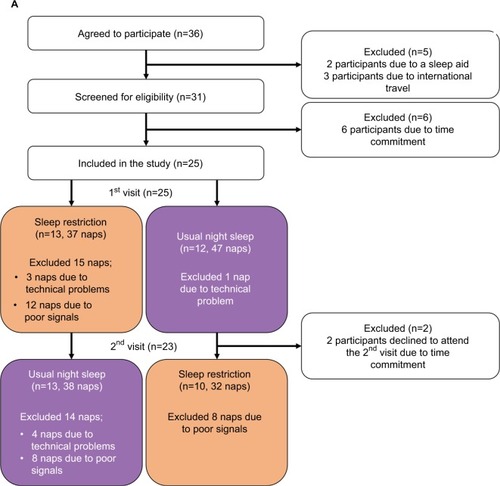
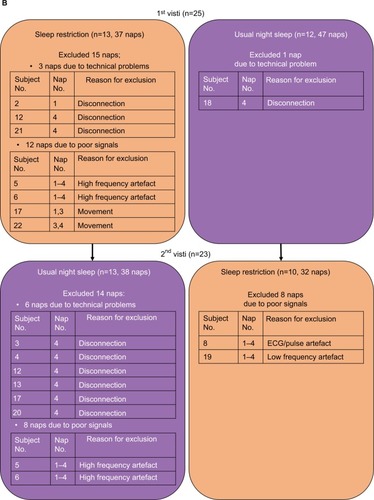
Table 1 Comparison between in-ear-EEG and scalp-EEG in detecting sleep latencyTable Footnoteb
Figure 4 Examples of signals from scalp-EEG and in-ear EEG.
Notes: (A) Examples for in-ear EEG (black) and scalp-EEG (blue) during four naps from one participant (26-year-old male) who did not remove the in-ear EEG sensor in between naps. (B) Examples for in-ear EEG (black) and scalp-EEG (blue) during four naps from one participant (25-year-old male) who removed the in-ear EEG sensor in between naps. Each EEG figure represents a 30-second epoch. Note that the amplitude of the in-ear-EEG was less than the scalp EEG in . However, inspection of the trends of power spectral density showed that they were similar over all 23 participants, for both scalp and in-ear EEG channels.
Abbreviation: EEG, electroencephalogram.
Abbreviation: EEG, electroencephalogram.
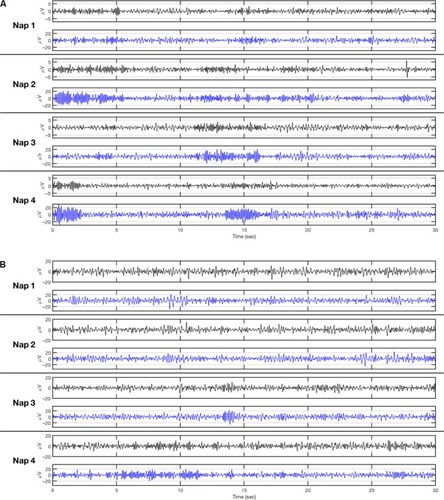
Figure 5 Bland-Altman agreement for scalp-EEG vs in-ear EEG.
Notes: (A) Bland-Altman agreement for individual naps (in-ear EEG minus scalp-EEG), usual night sleep visit (left) and sleep restriction visit (right). Dashed lines show the CI. (B) Bland-Altman agreement for all naps combined (in-ear EEG minus scalp-EEG), sleep restriction (orange) and usual night sleep (purple). Dashed orange lines are the CI for sleep restriction, whereas dashed purple lines show the CI for usual night sleep. Note that several data points are overlapped.
Abbreviation: EEG, electroencephalogram.
Abbreviation: EEG, electroencephalogram.
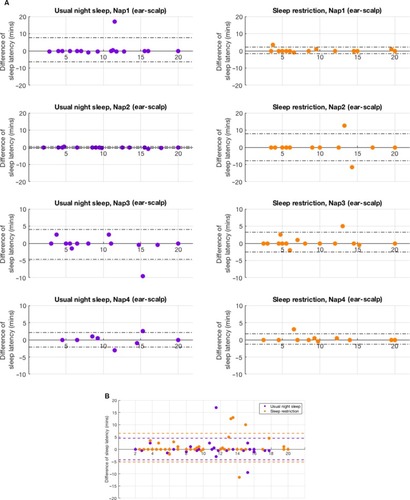
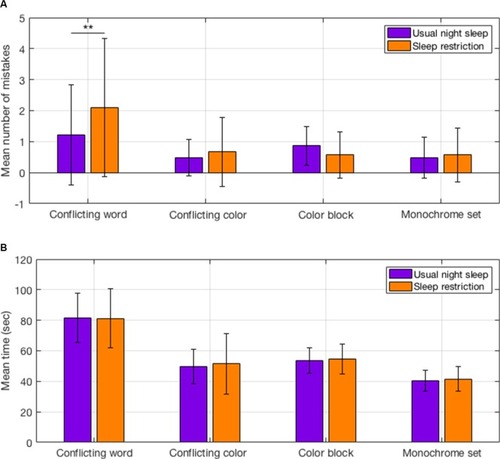
Figure 6 Stroop test after sleep restriction and after usual night sleep.
Notes: (A) The number of mistakes in each task. The highest number of mistakes was in the conflicting word task after sleep restriction, and this change significantly compared to after usual night sleep. (B) The mean time spent on each task (seconds). The time increased after sleep restriction in conflicting color, color block, and monochrome set, but did not reach significance level. **P=0.003.