Figures & data
Table 1 Demographics and ECG analysis across individual subjects
Table 2 Demographics and respiration analysis across individual subjects
Figure 1 Respiration measurements.
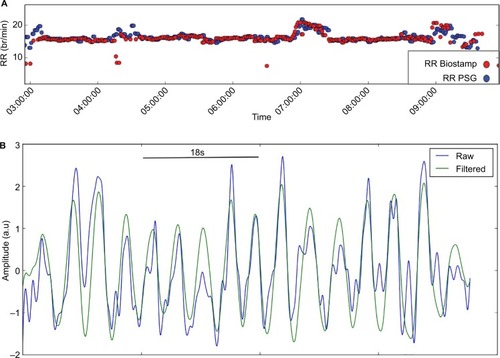
Figure 2 Electrocardiogram measurements.
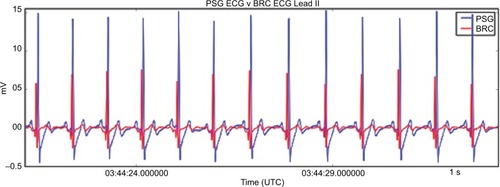
Figure 3 Limb movement detection example.
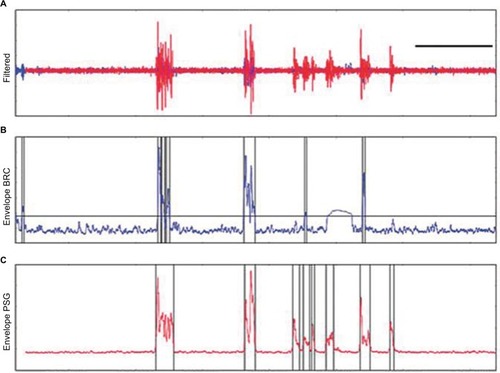
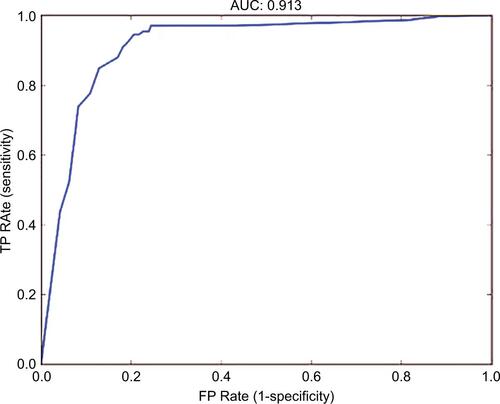
Figure 4 ROC curve for PLMS detection.
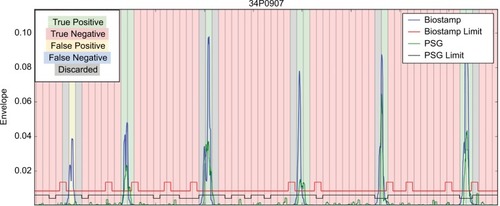
Figure S1 Schematic of signal processing of respiration signals.
Abbreviations: AXL, accelerometer; BRC, BiostampRC® sensor system; LP, low pass; PCA, principle component analysis; RMSE, root mean square error; RR, respiration rate; x, y, z, axes of the accelerometer; SQI, signal quality index.
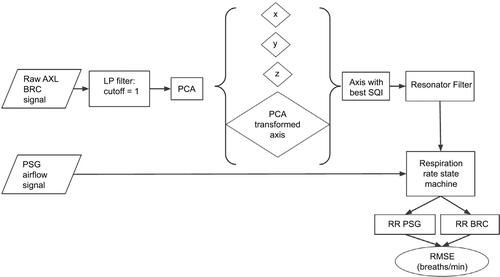
Figure S2 BiostampRC® device.
Note: Left, position on the lower leg; Right, close-up view of one device.
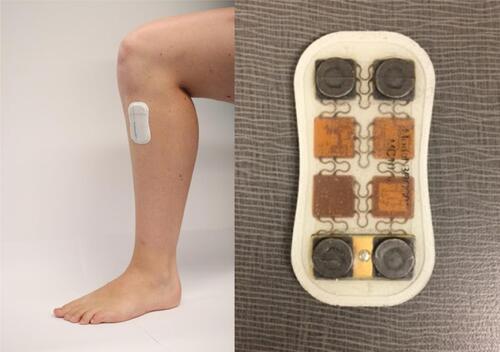
Figure S3 The true positive (TP) rate (ie, sensitivity) is shown on the y-axis, and the FP rate (ie, 1-speciificity) is shown on the x-axis
Abbreviations: AUC, area under the curve; EMG, electromyography; PSG, polysomnography; RMS, root mean square; TP, true positive.