Figures & data
Figure 1 Polysomnography synopsis from a 67-year-old non-ventilated male patient with spinal onset ALS. The figure depicts four tracings representing hypnogram, transcutaneous capnometry, pulse oxymetry, and graphical presentation of apneas or hypopneas (from top to bottom). Whereas capnometry shows hypercapnia which begins during REM and persists during the last third of the night, peripheral oxygen saturation is normal throughout the entire recording.
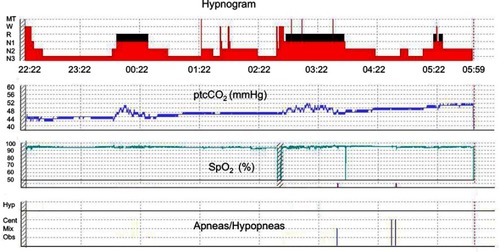
Figure 2 Polysomnography synopses from a 61-year-old non-ventilated patient with spinal onset ALS and clinically apparent respiratory muscle weakness before and after initiation of non-invasive ventilation (NIV). Both panels depict hypnogram, graphical presentation of apneas and hypopneas, transcutaneous capnometry, and pulse oxymetry (from top to bottom). (A) Sleep fragmentation with reduced sleep efficiency (65.6%), N3 percentage (13.3%), and REM percentage (6.1%). Sleep-disordered breathing is present, comprising severe obstructive sleep apnea (AHI 83.8/h, mean SpO2 88%) and nocturnal hypoventilation (mean ptcCO2 54.0 mmHg, maximum ptcCO2 63.7 mmHg). (B) Rapid improvement of objective sleep outcomes in the very first night of NIV treatment. Normalization of the AHI (0.3/h) and improvement of both CO2 elimination and oxygenation are evident (mean ptcCO2 52.0 mmHg, maximum ptcCO2 55.8 mmHg, mean SpO2 91%). In parallel, sleep architecture shows substantial increase of N3 and REM percentages (25.3% and 26.9%, respectively). Note that sleep-onset REM is present at the beginning of the night.
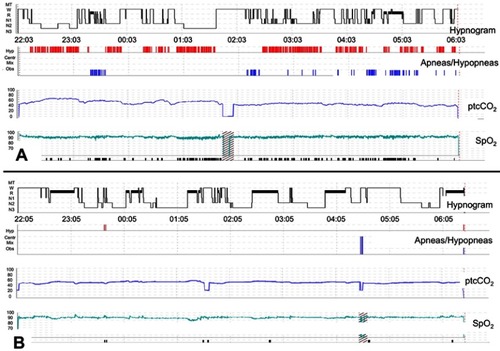
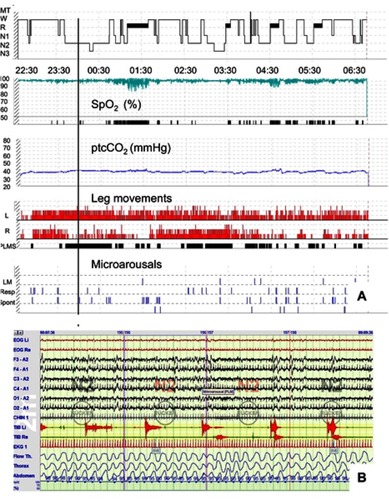
Figure 3 Periodic limb movements in sleep in a 62-year-old, non-ventilated patient with spinal onset ALS. (A) A polysomnography synopsis including hypnogram, oxygen saturation, transcutaneous ptcCO2, and graphical presentation of both leg movements (LM), and (micro)arousals from sleep (from top to bottom). Whereas capnometry is normal throughout the night, isolated obstructive sleep apnea is present leading to persistent desaturations (AHI 39.8/h). Almost permanent leg movements can be seen in both legs with long-lasting periodicity as reflected by the black bars within the fourth panel from above (PLMS). The PLM index was 117.1/h. However, only few PLM were associated with arousals from sleep, resulting in a PLM arousal index of no more than 5.4/h. (B) A 2-min excerpt from the same polysomnography with the timepoint according to the vertical black line in (A). Sleep stage is N2, and sleep-disordered breathing is absent. Only one of the 8 PLM which can be seen in the electromyography tracings (TIB L and TIB R, respectively) relates with an EEG arousal.