
Figures & data
Figure 1 Representation of photoreceptor thresholds, visual responses, and their relationship to the range of illumination from natural and artificial light sources.
Notes: This schematic illustrates estimated levels of visual stimulation for typical ambient-lighting conditions. Lux values are depicted on a logarithmic scale, focusing on photic intensities that fall within the range of responsiveness across classical rod and cone photoreceptors. Light intensities are not absolute and depend on biological variables (eg, pupillary response, direction of gaze) and physical properties of the stimulus (eg, spectral composition, direction of light), as described in further detail within the text. Under scotopic conditions, a certain amount of light is required to elicit any response (absolute threshold) and only rods are activated, which is a relatively rare condition in practice, as starlight alone begins to stimulate cone photoreceptors. With mesopic conditions, such as a moonlit night, both rod and cone photoreceptors are stimulated. At greater intensities of light in the photopic range, “bleaching” of the photoreceptors will gradually occur, and ultimately, with very bright light, retinal damage becomes a concern. There is likely to be significant overlap in the identified photopic range and ipRGC activation; however, ipRGC activation is not depicted in the figure due to a lack of consensus regarding precise quantification of the range of responsiveness to light. This is further complicated by the fact that ipRGC activation may vary by a variety of photic variables, such as the timing, spectral quality, and prior exposure history.
Abbreviation: ipRGC, intrinsically photosensitive retinal ganglion cell.
Abbreviation: ipRGC, intrinsically photosensitive retinal ganglion cell.
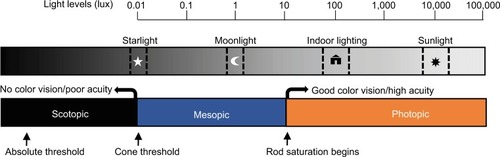
Figure 2 Actigram from a participant working day shifts (7 am–7 pm).
Notes: Time is represented from noon to noon on the x-axis, with days represented on the y-axis. Black markings and thin yellow lines denote activity and light levels across the day, respectively. Rest intervals appear in light blue, with sleep onset and offset represented as dark blue vertical lines, with blue shading between. Red markings appear underneath the activity when identified by the Actiware algorithm as “wake”. Yellow and orange bars above the rest-interval start and stop times indicate the 1- and 2-hour windows of the photosensor analyses.
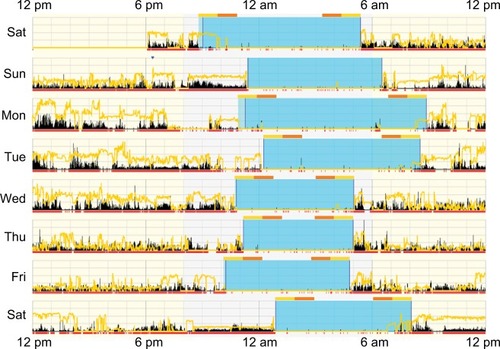
Figure 3 Flowchart of response frequencies for the four light questions at BT and WT.
Notes: Bolded text is used for questions and unbolded text for responses. Numbers in parentheses indicate the number of individuals who responded to that item. An asterisk denotes P<0.05 for differences in TA10 for the 2-hour interval post- and pre-BT and WT, respectively, by response (see for means). Parenthetical values outside boxes are erroneous or logically inconsistent responses that were excluded from analyses (see “Methods” section for details).
Abbreviations: BT, bedtime; WT, wake time; TALT, time above light threshold; TA10, TALT of lux.
Abbreviations: BT, bedtime; WT, wake time; TALT, time above light threshold; TA10, TALT of lux.
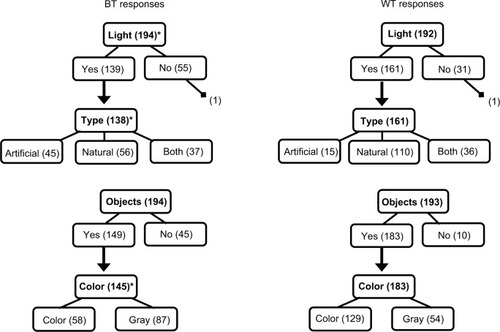
Table 1 Reported light and photopic illumination (TA10)
Table 2 Reported light and objective sleep
Table 3 Reported light and subjective sleep
Table S1 Reported light and photopic illumination for day- and nightshift workers (TA10)
Table S2 Reported light and objective sleep (actigraphy) by shift type
Table S3 Reported light and subjective sleep (diary) by shift type