
Figures & data
Figure 1 Bioboosti device.
Figure 2 Study schema. The structure of the study was as follows: (A) Baseline measurements: 1) 72-hr continuous EEG. 2) Actigraphy. 3) Diaries. (B) treatment period – 2 weeks, with continuous actigraphy and daily sleep log. (C) post-treatment: 72-hr EEG; sleep log and questionnaires.
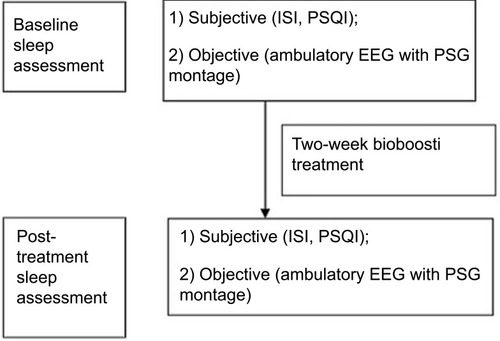
Figure 3 Recruitment flow. The structure of recruitment was as follows: (A) Potential subject shows interest in the research study. (B) Subject is screened and then invited to enroll if criteria is met. (C) Enrollment. (D) Completion/termination of study.
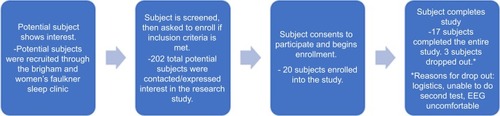
Table 1 Insomnia symptoms and sleep outcomes before and after treatment with BioBoosti