Figures & data
Table 1 Descriptive data for the 184 patient records analyzed for the AHI vs ODI comparisons and the 132 records used for the POSA analysis
Table 2 Distributions of sleep-disordered breathing measures across the 184 patient records (mean ± SD)
Figure 1 Bland Altman plots comparing the AHI vs ODI for (A) overall, (B) supine and (C) non-supine positions (n=184).
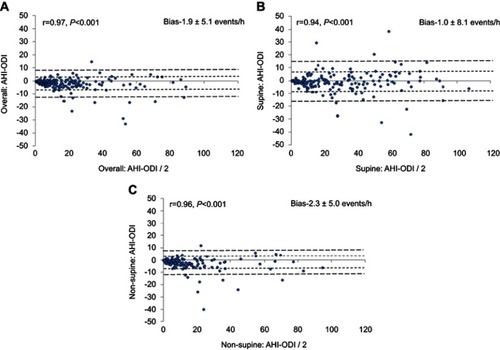
Figure 2 Percentage of 184 records with absolute differences between the overall AHI and ODI were ≥5 and ≥10 events/h or absolute difference >50% of the AHI, further stratified by those with mild (n=65), moderate (n=45), or severe OSA (n=31).
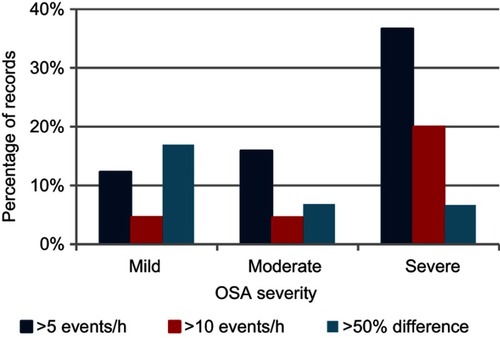
Table 3 Agreement between auto-scored AHI vs ODI stratified by sleep position and clinical cut-off (n=184)
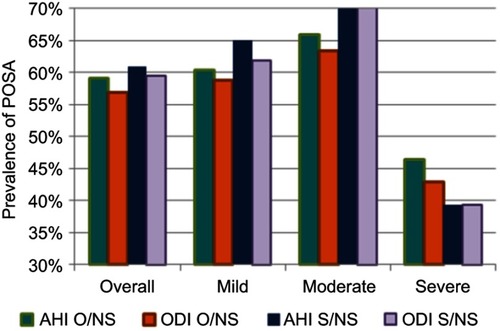
Figure 3 Distributions of POSA frequency (n=132) based on AHI vs ODI across all records (overall) and with records stratified by OSA severity based using the ratio of the overall/non-supine (O/NS)≥1.4 and the supine/non-supine (S/NS) ≥2.0.