
Figures & data
Table 1 Baseline characteristics of analyzed participants in the retirement and sleep trajectories study (n=1,516)
Figure 1 Histograms of baseline diary-reported and questionnaire-reported overall sleep durations in the retirement and sleep trajectories study (n=1,516)a. Key: Dark gray indicates questionnaire-reported sleep duration; light gray indicates sleep diary-reported sleep duration; dashed lines indicate the mean sleep duration for their respective measure. Each bar represents a 15 min block of sleep duration. aThere were 5,313 questionnaire-diary pairs for 1,516 study participants, and each participant returned at least one of potentially four questionnaire-diary pairs throughout the study duration. We used baseline questionnaire-diary pairs to generate the histograms.
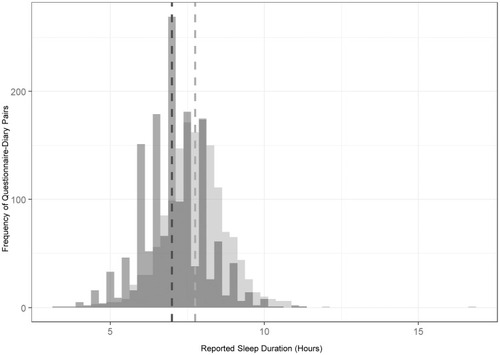
Table 2 Self-reported sleep duration measures on the sleep diary and questionnaire among participants in the retirement and sleep trajectories study at baseline (n=1,516)a
Figure 2 Bland-Altman plots of diary-reported and questionnaire-reported sleep durations by insomnia symptom status (A) and sleep apnea status in the retirement and sleep trajectories study (B) (n=5,313)a. Key: Circles indicate “No insomnia symptoms”; x’s indicate “Any insomnia symptom”; squares indicate “No self-reported sleep apnea”; stars indicate “Self-reported sleep apnea”; solid lines indicate the mean sleep duration difference; dashed lines indicate plus or minus two standard deviations from the mean sleep duration difference. Average of Sleep Durations = (diary-reported overall sleep duration + questionnaire-reported overall sleep duration)/2. Sleep Duration Difference = (diary-reported overall sleep duration) – (questionnaire-reported overall sleep duration). aThere were 5,313 questionnaire-diary pairs for 1,516 study participants, and each participant returned at least one of potentially four questionnaire-diary pairs throughout the study duration.
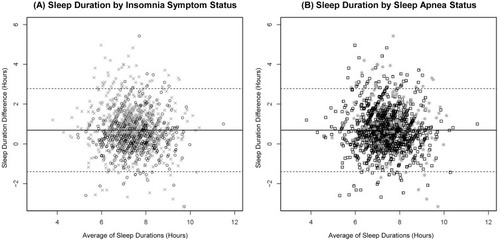
Table 3 Demographic predictors of the difference between diary-reported and questionnaire-reported overall sleep duration in the retirement and sleep trajectories study, with dichotomous insomnia exposure (n=1,516)
Table 4 Demographic predictors of the difference between diary-reported and questionnaire-reported overall sleep duration in the retirement and sleep trajectories study, with insomnia days per month exposure (n=1,516)