Figures & data
Table 1 Participant Characteristics
Figure 1 Schematic of the 5-day (4-night) laboratory study protocol.
Notes: Participants entered the laboratory at 14:00 on day 1 and remained in the laboratory until 14:00 on day 5. Distinct phases of the study are indicated above the schematic. The tick marks below the schematic indicate the study start and end times (14:00) and the bedtimes (22:00) and wake-up times (08:00). All other indicated clock times mark the start times of performance test blocks. Black: scheduled sleep; gray: performance testing.
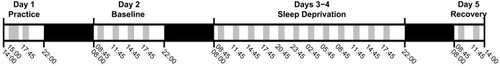
Figure 2 Psychomotor vigilance test results.
Notes: Means ± SE for lapses of attention (top), mean RT (middle), and false starts (bottom) on the 10 min PVT (left) and the 3 min PVT (right) across 38 h of total sleep deprivation and following recovery sleep. Data are plotted against the start times of performance test blocks. Cumulative time awake is shown across the top. Black: sleep-onset insomniacs; gray: healthy normal sleepers. Gray vertical bars: recovery sleep.
Abbreviations: PVT, psychomotor vigilance test; RT, reaction time.
Abbreviations: PVT, psychomotor vigilance test; RT, reaction time.
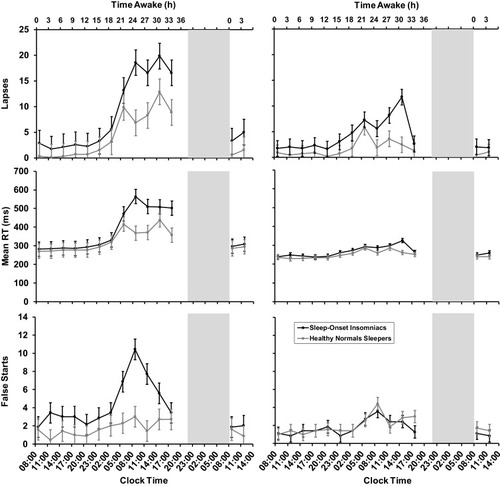
Table 2 F Statistics for Analyses of PVT Outcome Measures
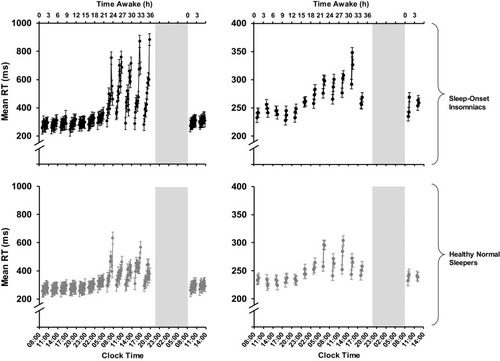
Figure 3 Time-on-task results.
Notes: Means ± SE for RT in 1 min bins on the 10 min PVT (left) and the 3 min PVT (right) across 38 h of total sleep deprivation and following recovery sleep. Data are plotted against the start times of the test blocks; placement of the 1 min bins in each test block is not to scale on the clock time axis. Cumulative time awake is shown across the top. Note the difference in vertical scale between the graphs on the left (10 min PVT) versus right (3 min PVT). Black (top graphs): sleep-onset insomniacs; gray (bottom graphs): healthy normal sleepers. Gray vertical bars: recovery sleep.
Abbreviations: PVT, psychomotor vigilance test; RT, reaction time.
Abbreviations: PVT, psychomotor vigilance test; RT, reaction time.