Figures & data
Figure 1 Flow-chart showing included and excluded patients.
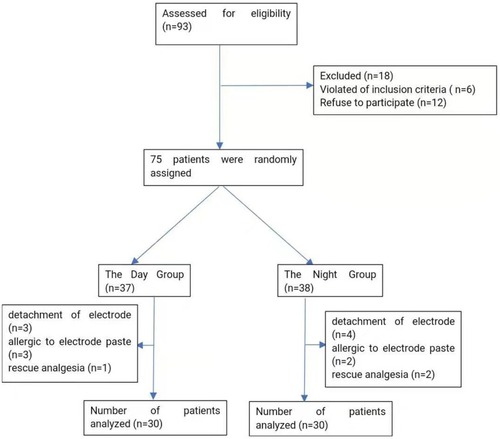
Table 1 Baseline Characteristics Of Patients In The Day Group And The Night Group
Figure 2 BIS, Heart rate (HR) and Mean arterial pressure (MAP) during the operation. (A) Intraoperative BIS at different time points; (B) intraoperative MAP at different time points; (C) intraoperative HR at different time points; * vs the Night Group: P < 0.05; ** vs the Night Group: P < 0.001. T0: 5 mins after entering the operation room; T1: Intubation; T2: 5 mins after intubating; T3: At the end of the operation; T4: Extubation; T5: 5 mins after extubating.
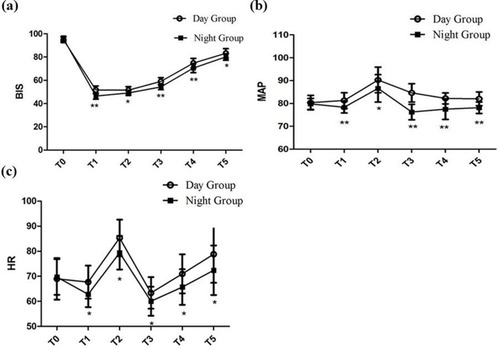
Table 2 Total Dose Of Dexmedetomidine And Remifentanil Of Patients In The Day Group And The Night Group
Figure 3 Comparison of sleep efficiency and the AIS scores between the Day Group and the Night Group. (A) Sleep efficiency; (B) AIS. AIS: The Athens Insomnia Scale; Sleep efficiency: the ratio of total sleep time/total recording time. Sleep 1: the night before surgery; Sleep 2: the first night after surgery; Sleep 3: the third night after surgery. In the same group, ** vs Sleep 1: P < 0.001. At the same point, # vs the Day Group: P < 0.05.
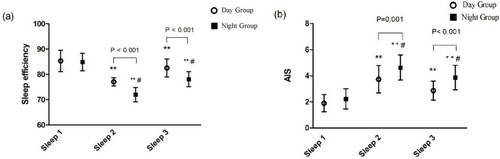
Figure 4 Comparison of the percentage of sleep stages distribution between the Day Group and the Night Group. (A) REM; (B) Stable sleep; (C) Unstable sleep. REM: Rapid eye movement; Sleep 1: the night before surgery; Sleep 2: the first night after surgery; Sleep 3: the third night after surgery. In the same group, * vs Sleep 1: P < 0.05; ** vs Sleep 1: P < 0.001. At the same point, # vs the Day Group: P < 0.05.
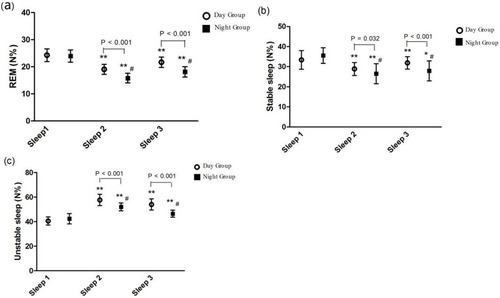
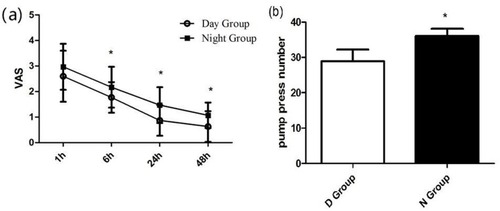
Figure 5 Postoperative VAS and PCA pump press numbers. (A) Postoperative VAS between the Day Group and the Night Group. (B) Postoperative PCA pump press number between the Day Group and the Night Group. VAS: Visual analogue scale * vs the Day Group: P < 0.05.