
Figures & data
Figure 1 Scatterplots showing individual measures of 8-hydroxy-2-deoxy guanosine (8-OHdG) (n = 12) during (A) baseline and (B) recovery of the antioxidant (gray circles) and placebo (white circles) trials. Bar graphs which show average measures of (C) 8-OHdG (n = 12), (D) 8-isoprostane (n = 11) and (E) glutathione (GSH) (n = 12). Measures of 8-OHdG, 8-isoprostane and GSH decreased during recovery compared to baseline during the antioxidant trial. In contrast, these same measures following exposure to intermittent hypoxia during the placebo trial were either increased or similar to baseline measures. Nonetheless, measures of oxidative stress during recovery of the antioxidant and placebo trial were similar (for explanation, see section “Oxidative Stress, Loop Gain, Arousal Threshold And Measures Of Apnea Severity”). *indicates as significantly less than baseline P < 0.05; Paired t-tests were used to make comparisons between baseline and recovery of the antioxidant or placebo trials.
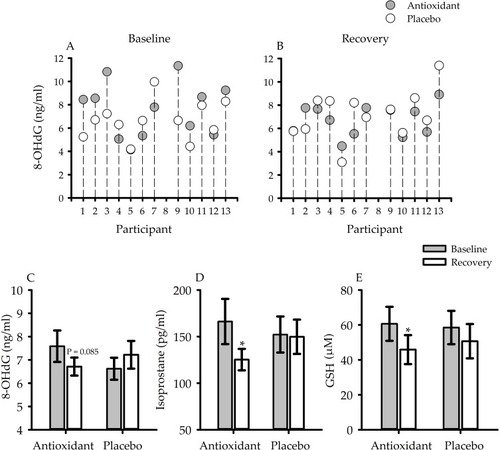
Table 1 Anthropometric Measures
Figure 2 Scatterplots showing the correlation between measures of 8-hydroxyl-2-deoxy guanosine (8-OHdG) and measures of arousal, apnea severity (apnea/hypopnea index, number of events in a 7-min segment, percentage of segment in which breathing was stable and event duration) and loop gain. The data shown are measures obtained from the antioxidant trial expressed as a fraction of measures recorded for the placebo trial. n = 12 participants. A Pearson correlation coefficient was used to complete the analysis. Black circle indicates a clear outlier.
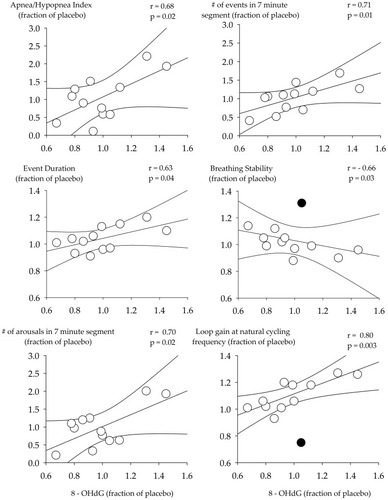
Figure 3 Scatterplots showing the correlation between loop gain (1 cycle/s) and measures of arousal (arousal index, ventilatory response to arousal, end-tidal carbon dioxide following an arousal), apnea severity (apnea/hypopnea index, apnea duration and the severity of oxygen desaturation) and airway collapsibility (ratio of hypopneas/apneas + hypopneas and the degree of flow limitation during hypopneas) during the antioxidant (gray circles) and placebo trials (white circles). Note that loop gain was significantly correlated to a number of indices of arousal and apnea severity. n = 13 participants. A Pearson correlation coefficient was used to complete the analysis.
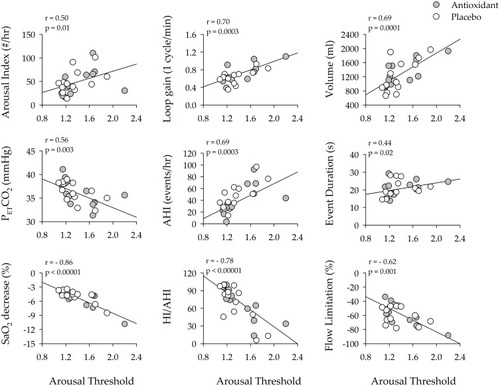
Figure 4 Scatterplots showing the correlation between arousal threshold and arousal severity (arousal index), the response to arousal (loop gain, ventilatory response to arousal, end-tidal carbon dioxide following an arousal), apnea severity (apnea/hypopnea index, apnea duration and the severity of oxygen desaturation) and airway collapsibility (the ratio of hypopneas/apneas + hypopneas, the degree of flow limitation during hypopneas) during the antioxidant (gray circles) and placebo trials (white circles). Note that arousal threshold was significantly correlated to a number of indices of arousal and apnea severity. n = 13 participants. A Pearson correlation coefficient was used to complete the analysis.
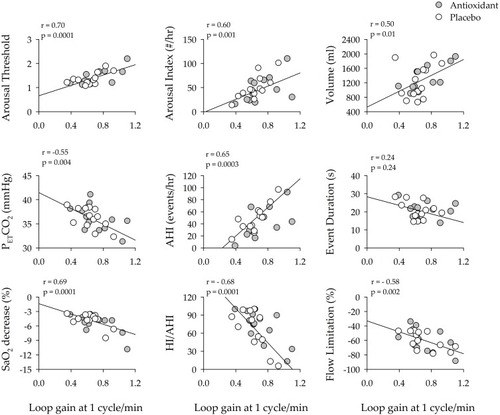
Table 2 Forward Stepwise Regression Analysis