
Figures & data
Figure 1 Flow chart of the study protocol and study patients.
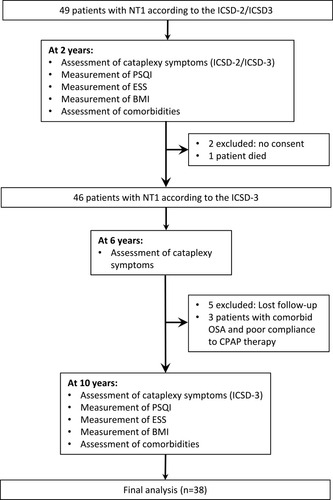
Table 4 The Frequency Of Cataplectic Attacks 2, 6, And 10 Years After Diagnosis With No Escalation Of Treatment
Table 1 Demographic And General Information. WASO Reflects The Duration Of Wakefulness Occurring After Defined Sleep Onset
Figure 2 An illustration of the values of the ESS score at recruitment and the end of the study. The dashed black line represents the cut-off value for a “normal” ESS score (≤10 points). The boxes demonstrate the mean and standard deviation of the ESS scores. Green lines represent patients who had an improvement in the ESS score, and the red lines represent the four patients who had an increase in the ESS score.
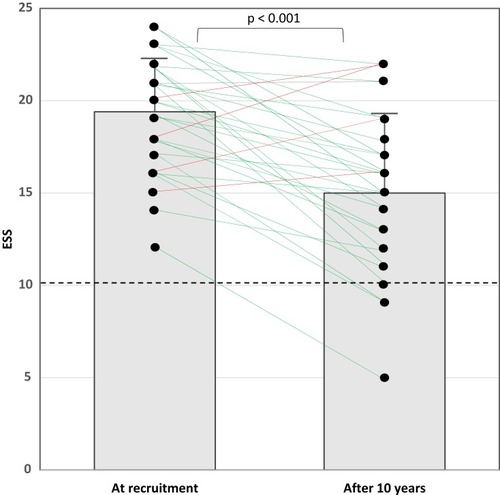
Table 2 Comparison Between BMI, ESS, PSQI, And Comorbidities At Diagnosis And After 10 Years
Figure 3 An illustration of the global Pittsburgh sleep quality index (PSQI) score at recruitment and the end of the study. The boxes demonstrate the mean and standard deviation of the PSQI scores. Green lines represent patients who had a decrease in the PSQI score, red lines represent patients with an increase in the PSQI score, and gray lines indicate patients with no change in the PSQI score.
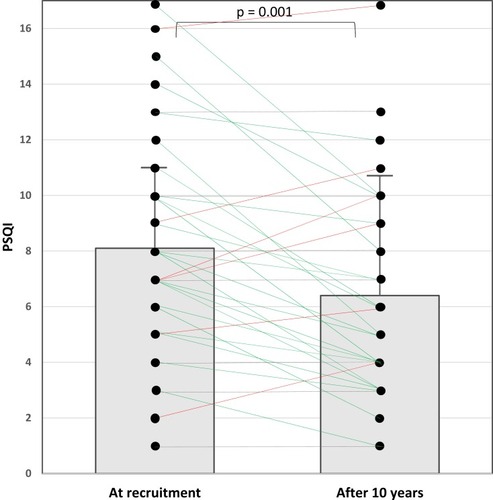
Figure 4 An illustration of the body mass index (BMI) at recruitment and the end of the study. The boxes demonstrate the mean and standard deviation of the BMI. Green lines represent patients who had a decrease in BMI; red lines represent patients with an increase in BMI.
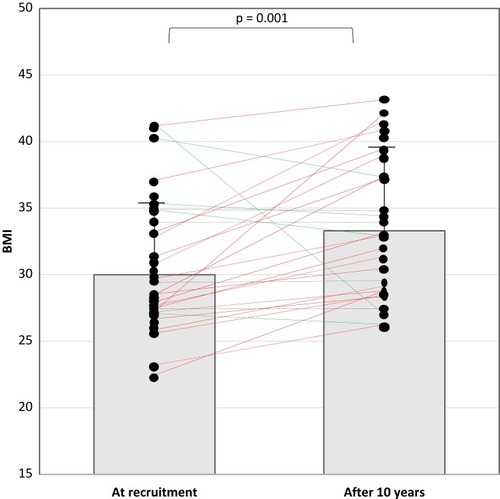
Table 3 Discontinuation Status Of Cataplexy Medications At The End Of The Study
Data Availability
Data are available but need institutional approval before sharing.