Figures & data
Figure 1 GO analysis of the differentially expressed proteins between IH-exposed HUVECs and the control group. The distribution bar charts of the biological processes (GO-BP), cellular components (GO-CC), and molecular functions (GO-MF) are shown.
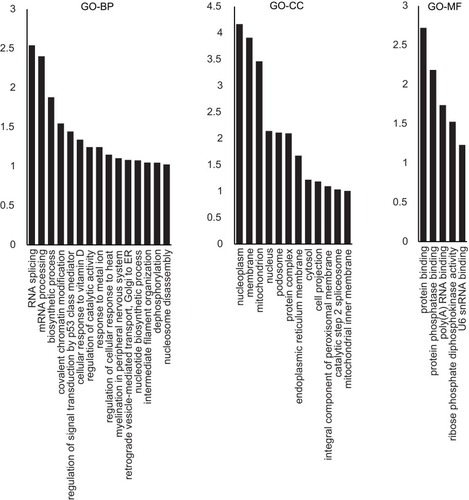
Figure 2 Differentially expressed proteins between IH-exposed HUVECs treated with or without estradiol (E2). Proteins up-regulated (107 proteins) and down-regulated (78 proteins) in IH-exposed HUVECs treated with estradiol (IH+E2) with p < 0.01 are denoted by red and blue colored dots, respectively, while proteins do not change significantly between IH and IH+E2 group are represented by grey dots.
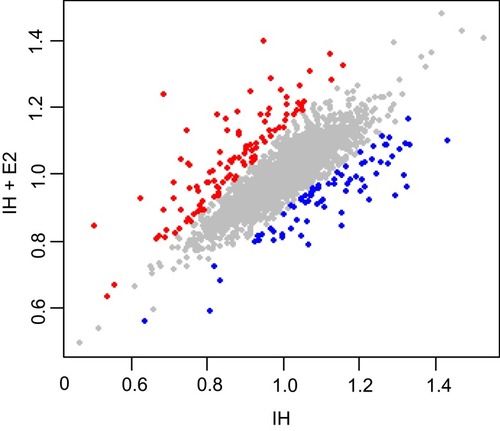
Figure 3 Functional annotation analysis of differentially expressed proteins between IH-exposed HUVECs treated with or without estradiol (E2). (A) GO analysis of the differentially expressed proteins. The distribution bar charts of the biological processes (GO-BP), cellular components (GO-CC), and molecular functions (GO-MF) are shown. (B) KEGG pathway analysis of the differentially expressed proteins.
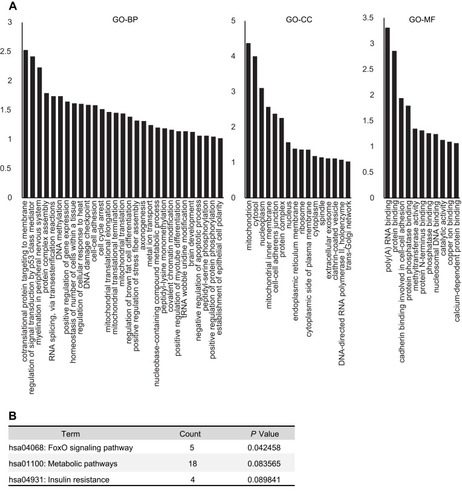
Figure 4 Protein–protein interaction network of the differentially expressed proteins between IH-exposed HUVECs treated with or without estradiol (E2). The protein–protein interaction network exhibited hubs containing proteins related to cellular stress response including ataxia telangiectasia mutated (ATM), DNA topoisomerase IIb (TOP2B), mammalian target of rapamycin (mTOR) and histone-lysine N-methyltransferase (EHMT1). The color and size of the nodes were set proportionally to the node degree by Cytoscape. The higher was the node degree, the larger was the size and brighter was the color of the node.
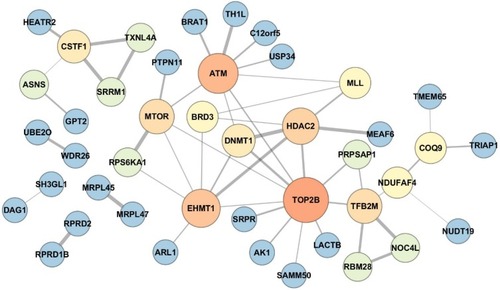
Figure 5 Verification of protein expression levels of ATM and c-IAP1 in IH-exposed HUVECs treated with or without estradiol (E2). E2 increased the levels of ATM and c-IAP1, and decreased the level of cleaved caspase 3 in IH-exposed HUVECs. Protein expression levels of ATM, c-IAP1 and downstream target, caspase 3, in IH-exposed HUVECs treated with or without E2 were verified by Western blotting. β-tubulin was used as an internal control.
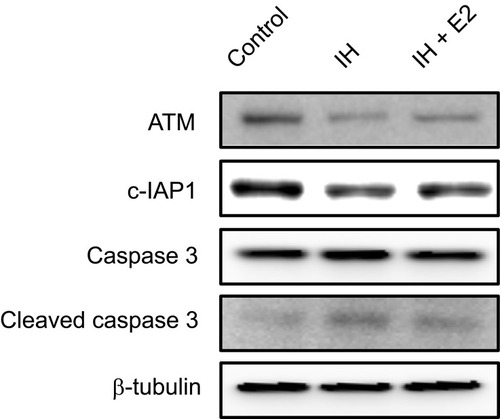
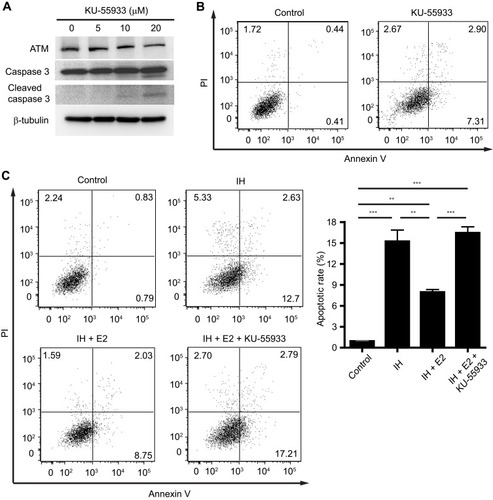
Figure 6 The anti-apoptotic effect of estradiol (E2) was abolished by inhibition of ATM. (A) HUVECs were treated with the indicated concentrations of KU-55933 for 24 hrs, which is a specific inhibitor for ATM. KU-55933 decreased the level of ATM, and increased the level of cleaved caspase 3 in HUVECs. Protein expressions of ATM, caspase 3, and cleaved caspase 3 were analyzed by Western blotting. β-tubulin was used as an internal control. (B) KU-55933 (20 µM) induced cell apoptosis in HUVECs. Representative flow cytometric analysis of cell apoptosis in HUVECs was shown. (C) E2 suppressed cell apoptosis in IH-exposed HUVECs, which was cancelled by KU-55933. The left panel shows the representative flow cytometric analysis of cell apoptosis in HUVECs, and the right panel shows the quantification of cell apoptotic rate. **P < 0.01 and ***P < 0.001 by one-way ANOVA followed by Tukey’s multiple comparison test.