
Figures & data
Table 1 Demographic and Clinical Characteristics of the Studied Sample
Table 2 Description of the Scored Hypopneas and Respiratory Effort Related Arousals in Respect to Electroencephalogram Arousals from Twenty-Four Consecutive in-Laboratory Polysomnography Participants
Figure 1 Sensitivity and specificity calculated for the different heart rate acceleration (HRa) and pulse transit time (PTT) cut-offs calculated with total sleep time.
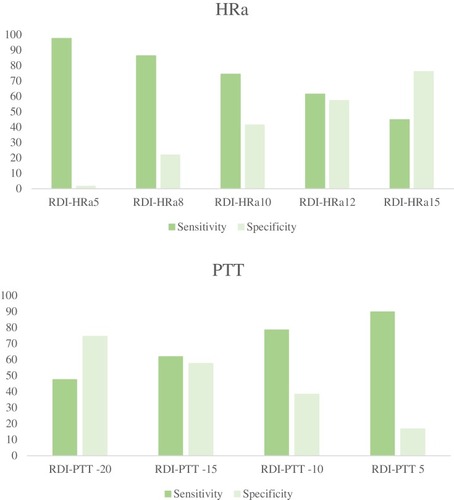
Table 3 Total Number of Non-Desaturating Hypopneas and RERAs Associated with EEG Arousals and Autonomic Arousals for the Twenty-Four Consecutive in-Laboratory Polysomnography Participants
Table 4 Different Respiratory Disturbance Indexes Calculated with Autonomic Arousals with Total Sleep Time (TST) and Total Recorded Time (TRT) for the Twenty-Four Consecutive in-Laboratory Polysomnography Participants
Table 5 Means and 95% Confidence Intervals Sensitivity and Specificity Values for the Different Heart Rate Acceleration (HRa) and Pulse Transit Time (PTT) Cut-Offs Calculated with Total Sleep Time
Figure 2 Bland–Altman plot demonstrating the mean difference between RDI-HRa10 vs RDIe in total sleep time (top) and RDI-HRa5 vs RDIe in total recorded time (bottom).
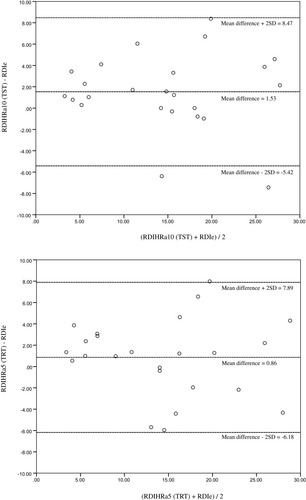
Table 6 Bland–Altman Analyses Comparing Different Cut-Offs for Autonomic Arousals to RDIe