
Figures & data
Table 1 Background Data for the Two Age Groups, and ANOVA Results for the Difference Between Groups
Figure 1 Demonstration of anatomically defined regions of interest (ROIs): insula cortex, hippocampus, frontal superior orbitofrontal cortex/rectus gyrus and thalamus.
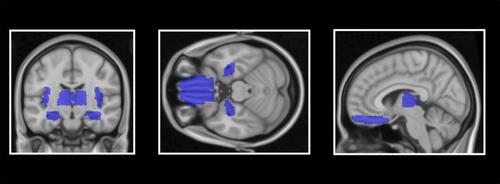
Table 2 Age Group Interactions of Associations Between Sleepiness (KSS Scores) and GM Volume
Figure 2 Demonstration of sleepiness (KSS scores)-associated thalamic gray matter volume in younger and older adults. The plots show the age interaction effect suggesting that sleepiness is negatively associated with left and right thalamus gray matter volume in older adults, but positively associated in younger individuals. The colors in the brain plot represent statistical t-values ranging from 0 (black) to 5.0 (white).
Abbreviation: KSS, Karolinska Sleepiness Scale.
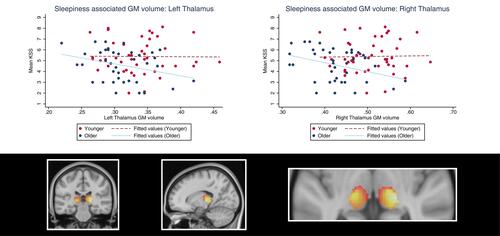
Figure 3 Demonstration of sleepiness (KSS scores)-associated insula gray matter volume in younger and older adults. The plots show the age interaction effect suggesting that sleepiness is positively associated with left and right insula gray matter volume in younger adults, but negatively associated in older individuals. The colors in the brain plot represent statistical t-values ranging from 0 (black) to 4.5 (white).
Abbreviation: KSS, Karolinska Sleepiness Scale.
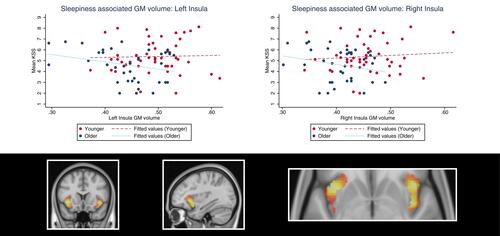
Table 3 Exploratory Whole-Brain Analyses on Age Group Interactions of Associations Between Sleepiness (KSS Scores) and GM Volume
Table 4 Exploratory Whole-Brain Main Effects of Associations Between Sleepiness (KSS Scores) and GM Volume for Both Groups Together.