Figures & data
Figure 1 Experimental protocol and the results of Y-maze testing. (A) Schematic representation of the six groups of rats exposed to different treatments. (B) The results of Y-maze testing in the six groups (n=6/group): repeated-measures ANOVA, Fgroup=4.427 *Pgroup=0.004, Fgroup*time=7.432 *Pgroup*time<0.001, Ftime=68.146 Ptime<0.001, ** P<0.05 by the post hoc Dunnett test.
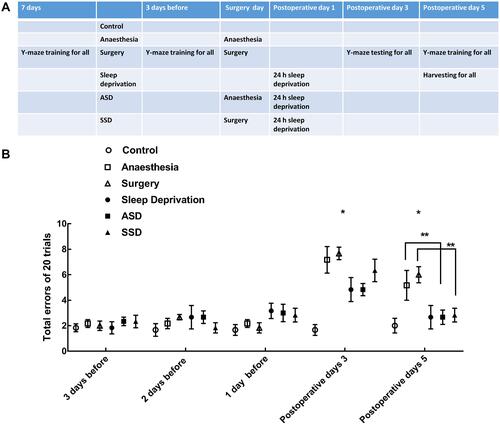
Figure 2 Changes in the blood–brain barrier (BBB) and the ultrastructure of hippocampal tissues after different interventions. (A) Changes in BBB permeability were measured based on visualization of Evans blue (EB) extravasation as indicated by red fluorescence under microscopy. (400×). (B) Quantification of EB fluorescence intensity (INT/mm2) (n=6), *F=78.124, P = 0.018 versus the Control group. (C) Transmission electron microscopy: arrows indicate mitochondrial swelling, vacuolation and endoplasmic reticulum dilatation in the hippocampal tissues of rats in the ASD and SSD groups. Scale bar = 2 μm.
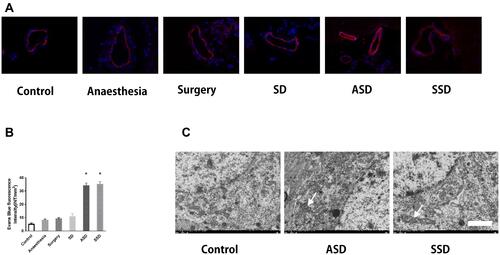
Figure 3 Changes in tau, FOXQ1 and IL-6 after different interventions. (A) Representative fluorescence images showing the distributions of IL-6 (red), Tau396 (green) and nuclei (blue) in the hippocampus of a rat in the SSD group. (B) Representative fluorescence images showing the distributions of FOXQ1 (red), Tau396 (green) and nuclei (blue) in the hippocampus of a rat in the SSD group. (C) Representative Western blots showing Tau396 and FOXQ1 expression. Actin was used as a loading control. (D) Quantification of the relative protein expression of tau396 (*F=4438.580, P <0.001 versus the Control group) and FOXQ1 in the 6 groups (*F=108.506, P <0.001 versus the Control group) (n=6). (E) Quantification of the relative plasma mRNA expression of IL-6 in all groups by RT-PCR, *F=34.943, P = 0.02 versus the Control group. (F) Quantification of hippocampal IL-6 by ELISA, *P < 0.001 versus the Control group. Data are expressed as the mean ± SD.
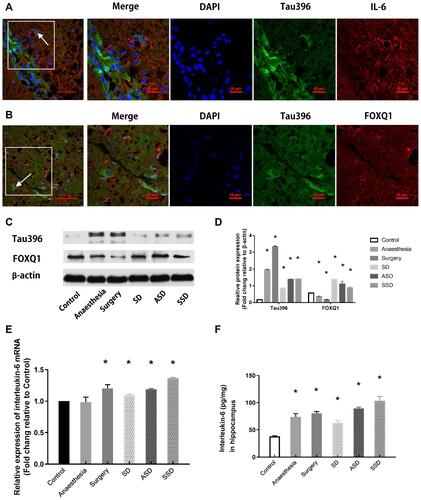
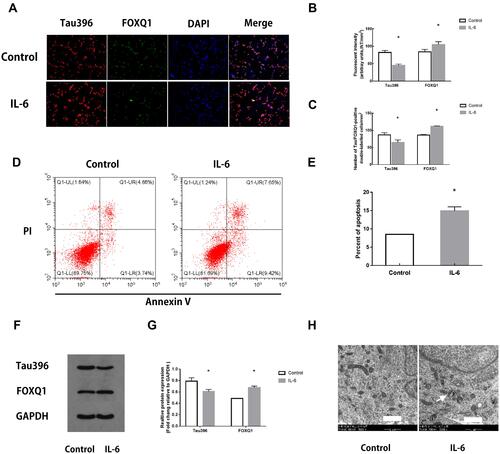
Figure 4 Changes in hippocampal neurons after IL-6 intervention. (A) Representative fluorescence images showing the distributions of tau396 (red), FOXQ1 (green) and nuclei (blue) in control hippocampal neurons and neurons co-cultured with IL-6. (B) Tau396/FOXQ1 expression was quantified based on the average of three independent images (n=6), *Ftau=0.120, P <0.001, *FFOXQ1=4.151, P <0.001 versus the Control group by t-test. (C) Quantification of tau396/FOXQ1-positive neurons (n=6), *Ftau=0.028, P <0.001, *FFOXQ1=8.000, P <0.001 versus the Control group by t-test. (D) Apoptosis in IL-6 co-cultured hippocampal neurons was evaluated by flow cytometry. The early apoptotic signal is localized to the A4 quadrant, and late apoptotic/necrotic signals are localized to the A2 quadrants of the dot-plot graphs. (E) Quantification of the percentage of apoptotic neurons. All samples were analysed in triplicate. Data are expressed as the mean ± SEM. *F=6.250, P=0.031 versus the Control group by t-test. (F) Representative Western blots showing Tau396 and FOXQ1 expression. GAPDH was used as a loading control. (G) Quantification of the relative protein expression of Tau396 and FOXQ1 in 2 groups (n=6), *Ftau=0.053, P <0.001, *FFOXQ1=0.109, P <0.001 versus the Control group by t-test. (H) Transmission electron microscopy: arrows indicate mitochondria swelling, vacuolation and endoplasmic reticulum dilatation in hippocampal neurons co-cultured with IL-6 (5000×). Scale bar = 1 μm.