
Figures & data
Table 1 Descriptive Statistics
Figure 1 Schematic figures of ESR1 (A) and GPER (B) promoter regions. (A) The DNA sequence of ESR1, chr6: 151805523–151805822, is located in a CpG island shore of promoter C, and it has been described as an enhancer (ID GH06J151804) of promoter A.Citation44 This region has been reported in humans and rats by Champagne et al, 2006,Citation23 Gardini et al, 2020,Citation35 Ianov et al, 2017,Citation46 and Tsuboi et al, 2017.Citation44 (B) The DNA sequence of GPER, chr7:1087059–1087533 is located in a CpG island across exons 1 and 2. This region has been assessed in Weissenborn et al, 2017.Citation45 White boxes represent exons or promoter regions. Underlined sequences correspond to the primers position. Bold “CG” correspond to the Interrogated CpGs.
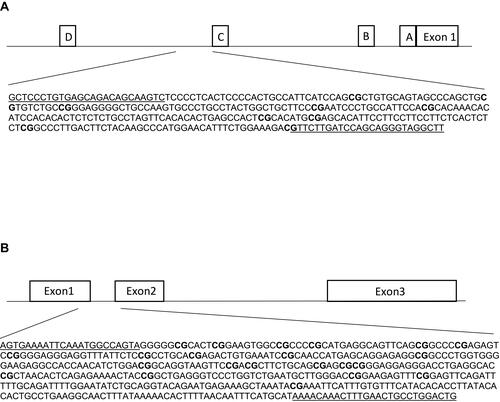
Table 2 PCR Primers Used for Amplification of DNA Sequences in the ESR1 and GPER
Figure 2 Path diagram (Macro Model 4) according to Hayes (2017).Citation62
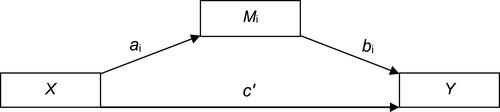
Figure 3 Path diagram of the mediation model (Macro Model 4),Citation62 illustrating the associations between ESR1 methylation (X) and sleep disturbances (Y) through VMS (Mi). Estradiol (E2), menopausal status (MS), depressive symptoms, body mass index (BMI), age and caffeine consumption were included in the model and controlled in each of the three paths (ai, bi, c’). Values outside parentheses= unstandardized b coefficient; values in parentheses= standard error; *= p-value < 0.05; **= p-value < 0.01.
Abbreviations: ESR1-m, estrogen receptor 1 methylation; VMS, vasomotor symptoms.
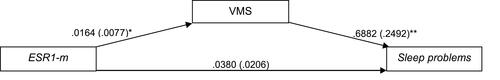
Table 3 Results of the Mediation Model with ESR1 Methylation as Predictor, 95% Bias-Corrected Confidence Interval Predicting Sleep Quality
Figure 4 Path diagram of the mediation model (Macro Model 4),Citation62 illustrating the associations between GPER methylation (X) and sleep disturbances (Y) through VMS (Mi). Estradiol (E2), menopausal status (MS), depressive symptoms, body mass index (BMI), age and caffeine consumption were included in the model and controlled in each of the three paths (ai, bi, c’). Values outside parentheses= unstandardized b coefficient; values in parentheses= standard error.
Abbreviations: GPER-m, G protein-coupled estrogen receptor methylation; VMS, vasomotor symptoms.
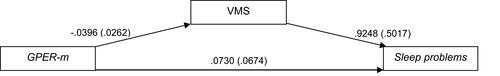
Table 4 Results of the Mediation Model with GPER Methylation as Predictor, 95% Bias-Corrected Confidence Interval Predicting Sleep Quality