
Figures & data
Table 1 The Averaging Results of Sleep Dairy from Two Weeks Preceding the Study
Figure 1 Balloon Analogue Risk Task (BART).
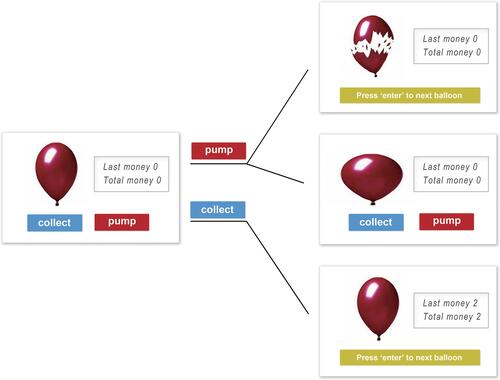
Figure 2 Go/no-go Task (GNG) task.
Note: The order of task 1 and task 2 was counter-balanced between different participants and sessions.
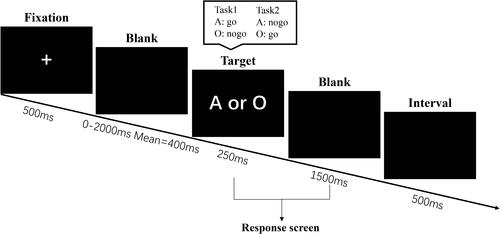
Figure 3 Psychomotor Vigilance Task (PVT) task.
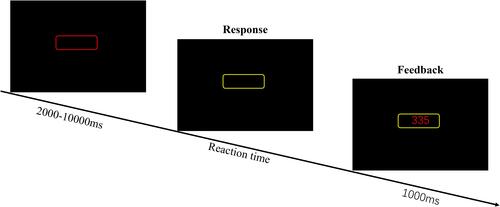
Figure 4 Experimental design and procedure.
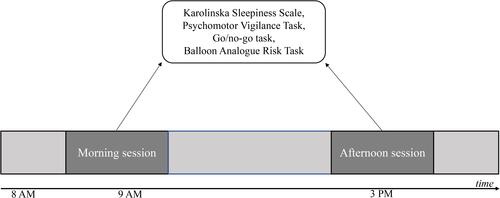
Table 2 Descriptive Statistics
Figure 5 Time-of-day effect on Balloon Analogue Risk Task (BART). (A) The adjusted average number of pumps on unexploded balloons, (B) The total gains, (C) The adjusted average number of pumps after negative feedback. *p<0.05, **p<0.01.
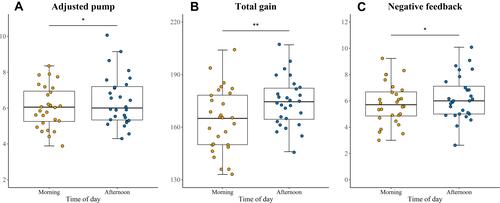
Figure 6 Time-of-day effect on No-go trials false rate which reflects the level of inhibitory control in Go/no-go task. **p<0.01.
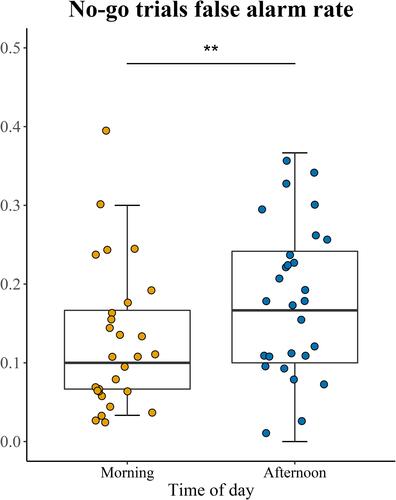
Table 3 The Correlation Between the Time-of-Day Effects on Risky Decision Making and Inhibitory Control