
Figures & data
Table 1 Sociodemographic and Polysomnography Data of iRBD Cases (n=12) and Controls (n=22)
Figure 1 Schematic presentation (A) of links between sleep in iRBD and caudate and putamen DaT uptakes. Serial SPECT images from representative iRBD patient (B) show labelling of the basal ganglia with 123I-FP-CIT.
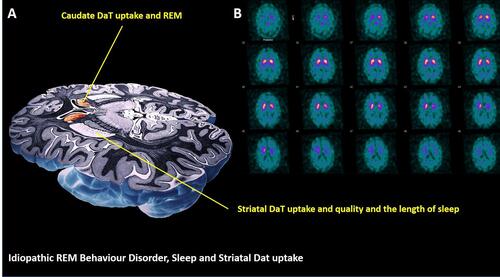
Table 2 DaTSCAN Imaging Characteristics in iRBD Patients (n=12)
Table 3 Correlation Between Polysomnography Derived Sleep Parameters and DaTSCAN Quantification in iRBD Patients (n=12)