Figures & data
Table 1 Demographics of the Employed Survey Respondents
Table 2 Prevalence of Sleep-Related Parameters in the Employed Survey Respondents
Figure 1 Binary logistic regression examining the associations between demographic and sleep parameters and missing work, making errors at work, or falling asleep at work for the entire employed population. Reference categories are male for gender, married for marital status, manual worker for employment type, never took sleeping medications for sleeping medications, good sleep quality for subjective sleep quality, 0–29 minutes for sleep latency, and normal for ESS. Points represent odds ratios (OR), error bars represent 95% confidence intervals (CI). *p < 0.05; ***p < 0.001.
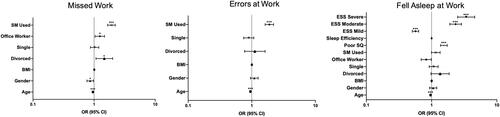
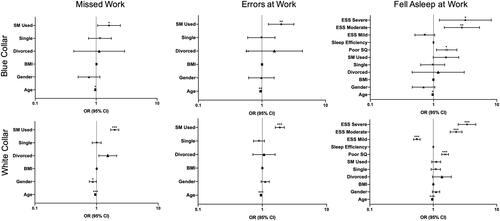
Figure 2 Binary logistic regression examining the associations between demographic and sleep parameters and missing work, making errors at work, or falling asleep at work for blue- and white-collar workers. Reference categories are male for gender, married for marital status, manual worker for employment type, never took sleeping medications for sleeping medications, good sleep quality for subjective sleep quality, 0–29 minutes for sleep latency, and normal for ESS. Points represent odds ratios (OR), error bars represent 95% confidence intervals (CI). *p < 0.05; **p <0.01; ***p < 0.001.