Figures & data
Figure 1 Pre-post changes in subjective sleepiness and sleep concerns across the school year. Means (and SE) of scores at the Pittsburgh sleep quality index (PSQI) and Epworth sleepiness scale (ESS) at the beginning and end of the academic year.
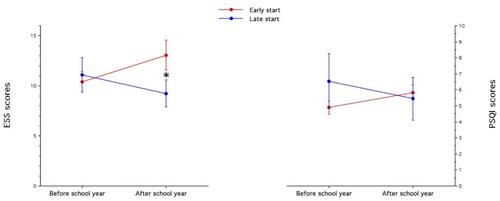
Figure 2 Academic performance at the beginning and end of the academic year. Means (and SE) of grades at two forms (entrance and final tests) administered in the late and early start classes at the beginning and end of the academic year. ***p≤.001, and “NS” to indicate non-significance.
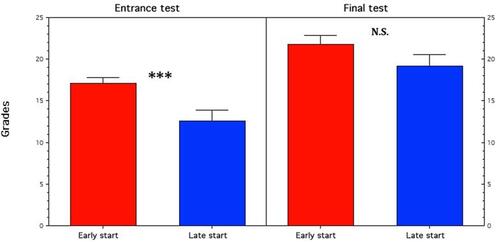
Table 1 Longitudinal Measures at the Baseline
Figure 3 Lights-off hour and bedtime in the two classes across the academic year. Means (and SE) of lights-off hour and bedtime (and, consequently, wake-up hour) in the late and early start classes.
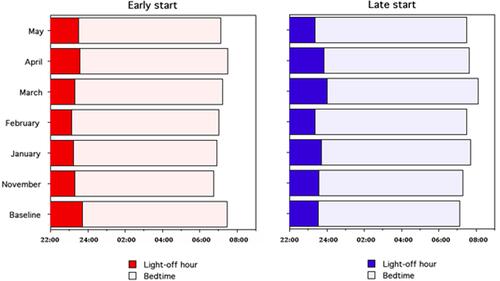
Table 2 Longitudinal Measures
Figure 4 Longitudinal changes in total sleep time and attentional performance across the academic year. Means (and SE) of percentage changes in total sleep time (panel (A) and measures of the Psychomotor Vigilance Task (panel (B) in the late and early start classes. *p≤.05, ***p≤.001.
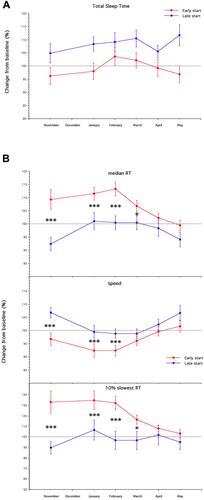
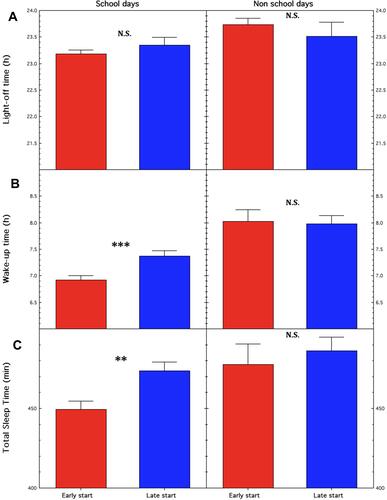
Figure 5 Lights-off hour, wake-up hour, and total sleep time as a function of school and non-school days. Means (and SE) of (A) lights-off hour, (B) wake-up hour, (C) total sleep time in the late and early start classes plotted as a function of school and non-school days. ***p≤.001, **p≤.01, and “NS” to indicate non-significance.