
Figures & data
Figure 1 Study flow diagram.
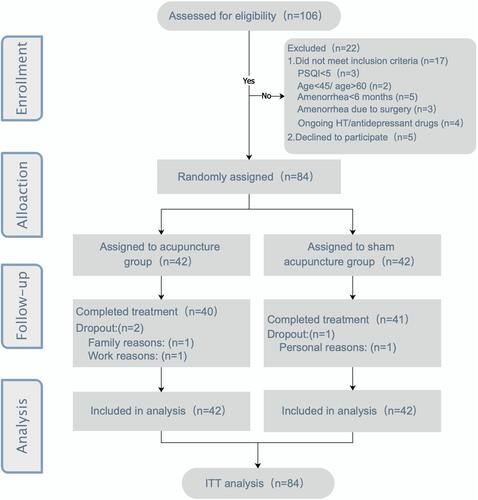
Table 1 Baseline Characteristics of Participants, by Group
Table 2 Changes from Baseline of PSQI and Men-QoL Outcomes at the End of Treatment (8-Week) and the 12-Week and the 20-Week Follow-Up Visits by Group
Table 3 Seven Components of PSQI Changes from Baseline to the End of Treatment (8-Week) and the 12-Week and the 20-Week Follow-Up Visits by Group
Figure 2 Adjusted mean (95% CI) change from baseline in PSQI scores.
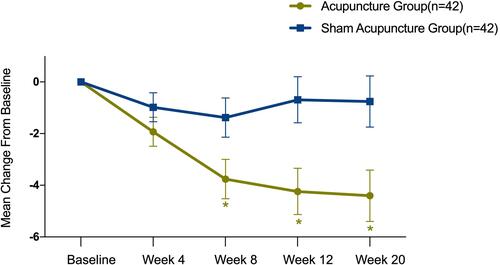
Table 4 Actigraphy Assessments at Baseline and the End of Treatment (Week 8) by Group
Table 5 ISI, SAS and SDS Outcomes at Baseline and the End of Treatment (Week 8) by Group
Table 6 Use of Estazolam for Insomnia, by Group, n (%)
Table 7 Results of the Blinding, by Group
Table 8 Adverse Events, by Group, n (%)