Figures & data
Figure 1 Schematic representation of protocol for an example participant. Black bars represent sleep episodes, grey bars represent day shifts, yellow bars represent night shifts with light exposure analysed. Closed circles represent scheduled testing during night shifts. Where possible the order of light exposure conditions (traditional: 43 lux, 4000 K; intervention: 106 lux, 17,000 K) were counterbalanced between shift roster groups.
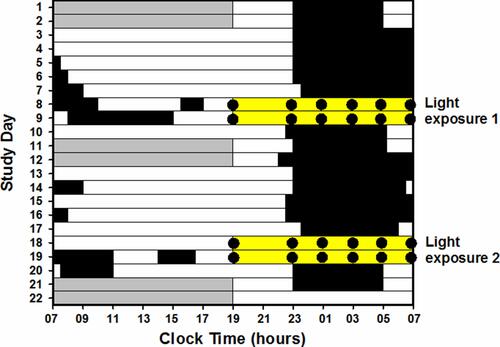
Figure 2 Spectral power distribution of the fluorescent light sources used in the intervention (blue line) and traditional (black line) light conditions, expressed relative to total power in the 380–760 nm range. The panel shows mean vertical and horizontal illuminance levels of each light condition in lux, measured across the most populated areas of the control room. Measures of illuminance were taken at a height of 122 cm from the floor level, representative of a workers’ seated position. Simulated, laboratory simulation of light sources where the photopic lux value was scaled to match the observed lux measured on site to provide relative α-opic equivalent (D65) illuminance (EDI, lux) for each of the five photoreceptors and the melanopic daylight efficacy ratio (DER, the ratio of melanopic/photopic lux).Citation31
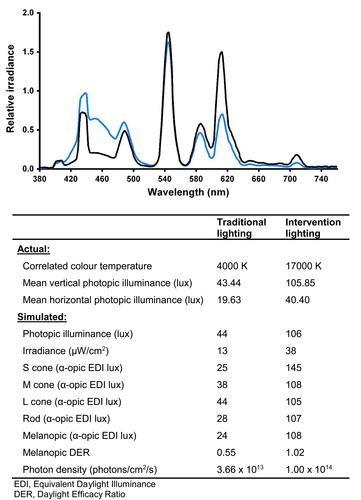
Table 1 Participant Characteristics of Night Shift Workers. Data Presented are Mean ± SD Unless Otherwise Stated
Table 2 KSS, PVT Performance and Mood (Mean ± SD) Assessed at the Start, Middle and End of the Night Shifts Under Conditions of Traditional and Intervention Lighting. Data Presented are Averaged Across Two Consecutive Night Shifts. Higher Values on Subjective Mood Scales Indicate Worse Outcomes (Tense, Miserable, Depressed)
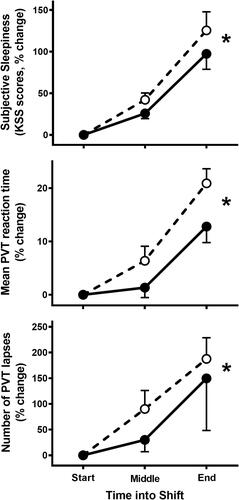
Figure 3 Changes in subjective sleepiness, PVT reaction time, and number of PVT lapses averaged between two night shifts under conditions of traditional (43 lux, 4000 K; open circles) and intervention (106 lux, 17,000 K; closed circles) lighting. *Indicate significant main effect of light condition (p<0.05).