
Figures & data
Table 1 Socio-Demographic Factors and Variables of Interest in CHILD-SLEEP and FinnBrain
Table 2 Associations Between Genetic Risk for Diurnal Preference and Mean Standard Scores for Each Sleep Domain, in CHILD-SLEEP
Figure 1 Sleep-onset latency and genetic risk for diurnal preference in early childhood. This graph presents the mean and standard error (SE) in parent-reported sleep-onset latency in early childhood, for each quartile of PRSBestFit (A) and PRS10kBest (B), in the CHILD-SLEEP cohort. The measure of parent-reported sleep-onset latency in childhood refers to mean standard scores at three, eight, 18 and 24 months, from the Infant Sleep Questionnaire. Graph A indicates that those subjects situated in the 4th Quartile (ie higher PRS for eveningness) report higher mean standard score values in ISQ sleep-onset latency (ie longer sleep-onset latency). Accordingly, graph B shows that those infants located in the 4th Quartile (ie higher PRS for morningness) obtain lower mean standard values in ISQ sleep-onset latency (ie short sleep-onset latency). Error bars represent 2SE, indicating 95% of values that are less than two standard errors (2SE) away from the mean.
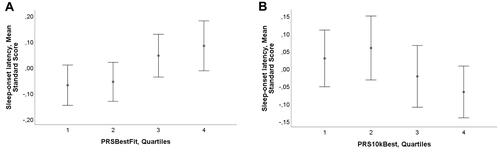
Figure 2 Forest plot from the meta-analysis, concerning genetic risk for diurnal preference and sleep-onset latency in early childhood. This graph provides a graphical display of the estimated results when we combined the data from both cohorts (CS and FB) to perform meta-analysis. Graph (A) represents the forest plot from the meta-analysis, concerning the association between PRSBestFit and sleep-onset latency in early childhood. Graph (B) represents the forest plot from the meta-analysis, concerning the association between PRS10kBest and sleep-onset latency in early childhood. First dark blue square on the top, in each graph, represents the standard mean differences (and 95% Confidence Intervals) for sleep-onset latency measured with Infant Sleep Questionnaire in CS, and the dark blue square below, in each graph, refers to the standard mean differences (and 95% Confidence Intervals) for sleep-onset latency measured with Brief Infant Sleep Questionnaire in FB. The light blue diamond on the bottom appearing in each graph represents the overall effect estimate.
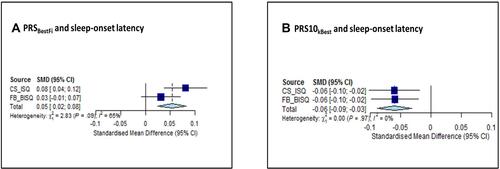
Table 3 Associations Between Genetic Risk for Diurnal Preference and Actigraphy-Based Sleep Variables, in CHILD-SLEEP