Figures & data
Table 1 Characteristics of the Surveyed Sleep Centers
Figure 1 The distribution of the sleep centers that responded to this survey.
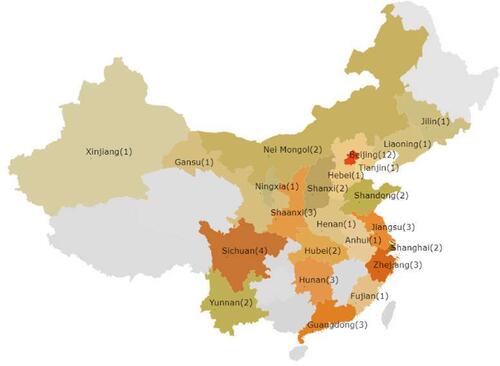
Table 2 Changes in Sleep Service Activities During the COVID-19 Pandemic
Table 3 Correlates of the Number of Sleep Tests and Proportion of PSG During Different Periods of the Pandemic
Figure 2 Changes in patient volume and mode of sleep study during the pandemic. The length of the column represents the number of sleep studies and the number on the column represents the proportion (median) of sleep study procedure (blue column for polysomnography and orange column for polygraphy).
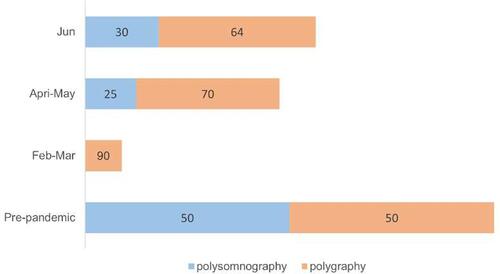
Table 4 Correlates of the Number of PAP Titration and Proportion of Home Autotitration During Different Periods of the Pandemic
Figure 3 Changes in patient volume and mode of positive airway pressure titration. The length of the column represents the number of titrations and the number on the column represents the proportion (median) of titration procedure (blue column for lab manual titration, orange column for lab auto titration, and grey column for home auto titration).
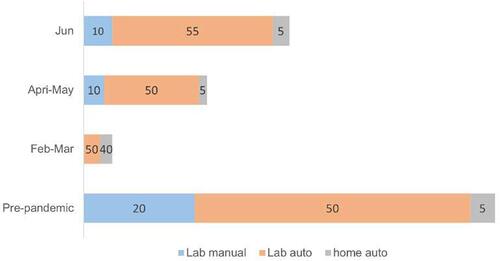
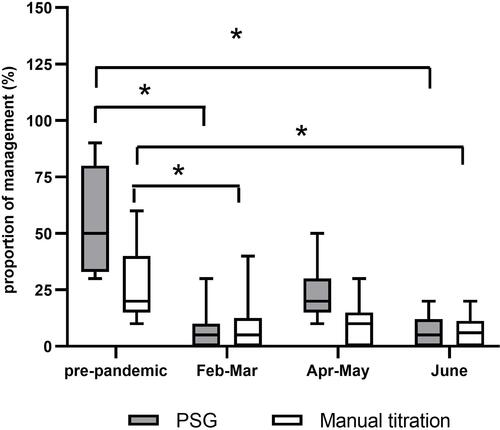
Figure 4 Changes in laboratory polysomnography and manual titration in the 12 sleep centers in Beijing during the pandemic. *p<0.05 compared with the pre-pandemic level.