Figures & data
Figure 1 Conceptualization of the survival curve analysis.
Notes: Please note that this figure is fictional and does not represent real data. Step 1 depicts a schematic example of sleep and wake over time. Only one sleep cycle is depicted. During step 2, all fragments of NREM sleep are listed and sorted based on their length. Fragments of NREM sleep are assumed to be terminated if they are followed by either wake or REM sleep. In step 3, NREM fragments shorter than 1 minute are excluded from the analysis. At the right, the resulting survival function is plotted. The survival rate represents the percentage of NREM fragments longer than a certain length, e.g. after 1 minute, three out of five (60%) of the sleep fragments is still left (ie, “has survived”), and after 5 minutes only one sleep fragment (20%) is left. In other words, only 20% of the sleep fragments is longer than 5 minutes. In reality, there are multiple sleep cycles, and thus more sleep fragments. Survival curves of REM sleep and wake were calculated using a similar approach. Reprinted under a Creative Commons Attribution 4.0 International License from: Hermans LWA, Regis M, Fonseca P, et al. Assessing sleep-wake survival dynamics in relation to sleep quality in a placebo-controlled pharmacological intervention study with people with insomnia and healthy controls. Psychopharmacology. 2020;238:81–94.Citation15
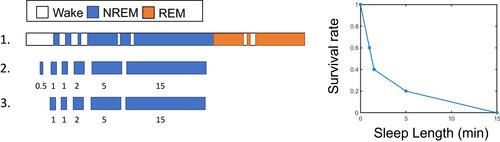
Table 1. Descriptive Statistics of Participants
Table 2. Frequency (Percentage) of Co-Morbidities Within the Insomnia Group
Table 3. Results of Sleep and Wake Survival Analysis
Table 4. Results of Sensitivity Analysis of Wake Parameters, Including Only Participants Older Than 29
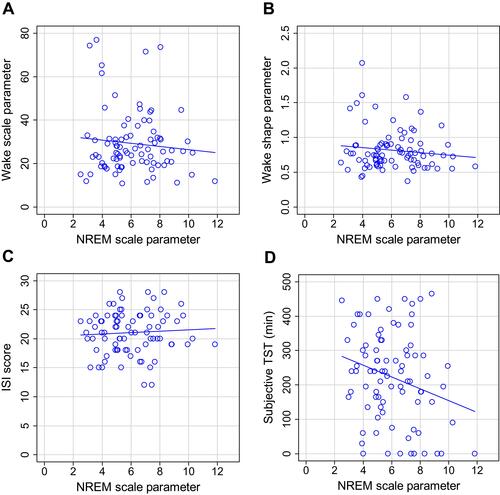
Figure 2 Correlations between survival parameters and subjective sleep.
Notes: (A) NREM scale parameter vs wake scale parameter. (B) NREM scale parameter vs wake shape parameter. (C) NREM scale vs Insomnia Severity Index. (D) NREM scale parameter vs subjective total sleep time.