
Figures & data
Table 1 Demographical information.
Table 2 No of observations for all variables of interest in the present study.
Table 3 Sleep in allergy and controls.
Figure 1 Objective sleep parameters based on the one-channel EEG for allergy patients and healthy controls. All box plots show median values, 25th and 75th percentile and whiskers show 95% CI. Individual data points represent single nights. Ctrl-all = allergy control subjects. (A). Deep sleep (SWS). (B). Light sleep. (C). REM sleep. (D). Sleep efficiency, calculated as the percentage of sleep (TST) out of the time the electrode was used (time in bed, TIB). Y-axis truncated for visualization.
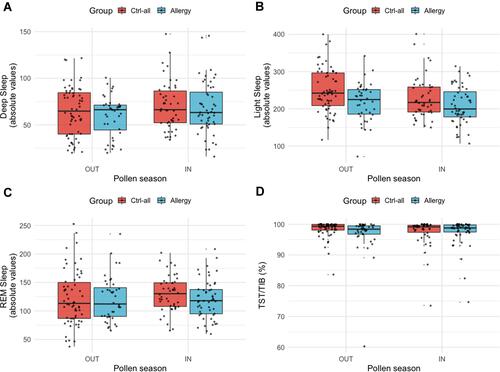
Table 4 Sleep parameters in RA patients.
Figure 2 Objective sleep parameters based on the EEG for RA patients and healthy controls. All box plots show median values, 25th and 75th percentile and whiskers show 95% CI. Individual data points represent single nights. Ctrl-RA = RA control subjects. (A). Deep sleep (SWS). (B). Light sleep. (C). REM sleep. (D). Sleep efficiency, calculated as the percentage of sleep (TST) out of the time the electrode was used (time in bed, TIB). Y-axis truncated for visualization.
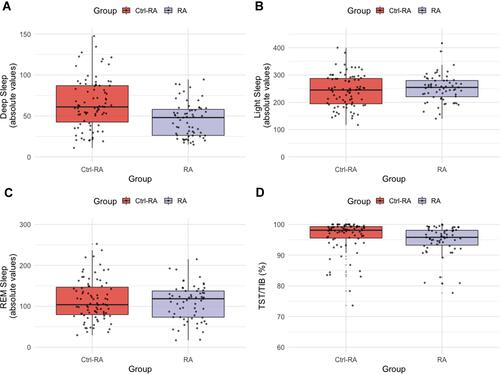
Table 5 Possible predictors of sleep variables across allergy patients, RA patients and healthy controls, investigated in a linear mixed effects model. For deep sleep and TST, effect estimates correspond to minutes. Sickness and RA significantly interacted for sleep quality, whereas no other predictor was significantly associated to sleep parameters or interacted significantly with the sleep parameters. All numbers derive from linear mixed effects models. See supplementary for analyses controlled for sex and age.