Figures & data
Table 1 Percentages of Time Spent in Each Sleep Stage in Each Quarter of the Night
Figure 1 Distributions of sleep stages throughout the night. Stacked area plot of the proportions of sleep stages among all participants as a function of time of the night (from time at lights out at 23:00 until next morning at 7:00) calculated at 10-minute intervals.
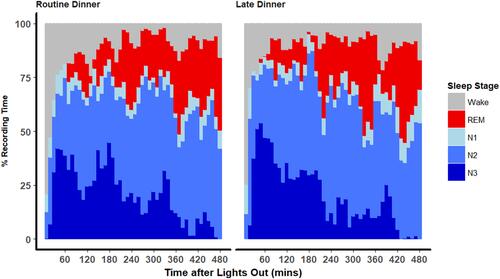
Table 2 Mixed-Effect Spline Regression Models of EEG Spectral Power Distributions
Figure 2 Distributions of EEG spectral power bands throughout the night. Median percentages (solid red and blue lines) and interquartile ranges (shaded red and blue areas) for each spectral power band over the course of the night (from time at lights out at 23:00 until next morning at 7:00) are shown. In the beginning of the night, late dinner increased delta power and reduced alpha and beta power. These differences were attenuated in the latter part of the night.
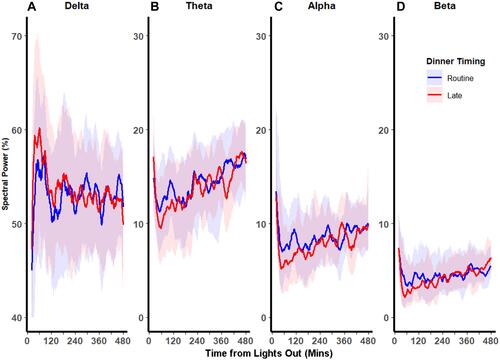
Figure 3 Spline regression models of the distributions of EEG spectral power bands as a function of dinner timing and time of night. Fitted mixed-effect spline regression model of mean percentages of spectral in each power band vs time from lights out after routine (solid line) and late (dashed line) dinners. Knots (circle and triangles after routine and late dinners, respectively), were placed at every 60 minutes. In the beginning of the night, late dinner was associated with increased delta power (Panel A) and reduced theta (Panel B), (Panel C) alpha, and (Panel D) beta power. In the latter part of the night, these differences were reversed for alpha and delta powers and were attenuated for beta and theta powers.
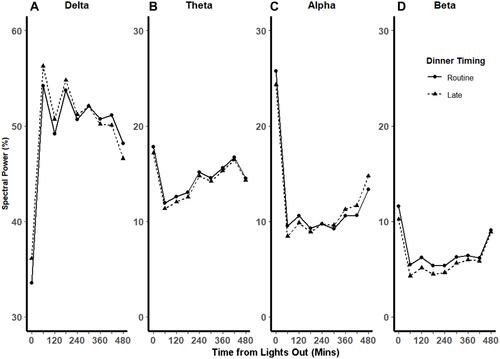
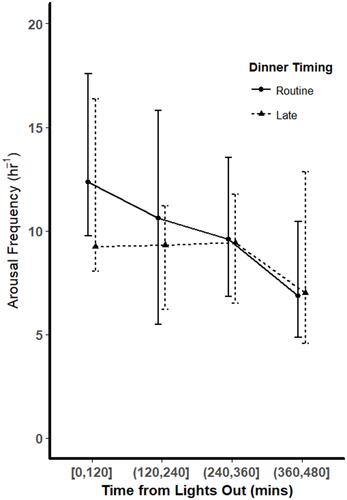
Figure 4 Arousal frequencies throughout the night. Arousal frequencies (number of arousal periods per hour of sleep) were tallied for each quarter of the night (each 120 minutes) for both routine dinner (solid line) and late dinner (dashed line) conditions. Overall, the arousal frequencies decreased over the course of the night. There were no significant differences in arousal frequencies between the 2 dinner conditions in any quarter of the night (p > 0.05 using Wilcoxon signed-rank tests).