Figures & data
Table 1 Sociodemographic Characteristics of Participants (n=657)
Table 2 Model Fitting Results for 3- to 5-Class Solutions in the Latent Class Analysis (n=657)
Table 3 Univariate Analysis for Sleep-Wake-Related Disturbances in Subgroups (n=657)
Figure 1 The co-occurring patterns between domains of depressive symptomatology with global scores and component scores in the Pittsburgh Sleep Quality Index (PSQI). C: cognitive domain; A: affective domain; S: somatic domain. The number (odds ratio) and thickness of the lines linking each domain and PSQI-related components reflect the effect sizes of associations. The co-occurring patterns are illustrated by participant groups. Panel (A): total participants. Panel (B): the poor sleep quality with high insomnia (PSQ+HI) group. Panel (C): the poor sleep quality with moderate insomnia (PSQ+MI) group. Panel (D): the poor sleep quality with low insomnia (PSQ+LI) group.
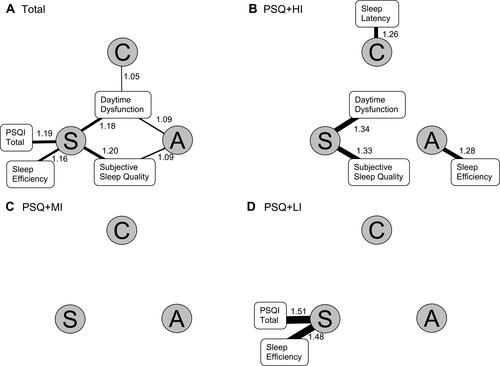
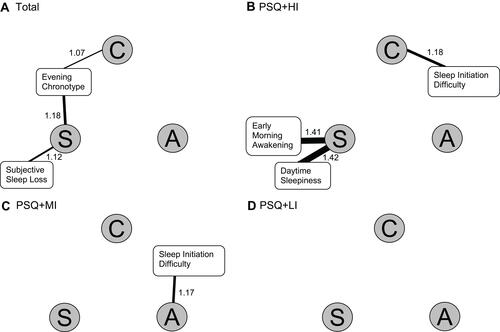
Figure 2 The co-occurring patterns between domains of depressive symptomatology with various nighttime and daytime symptoms of insomnia and chronotype preferences. C: cognitive domain; A: affective domain; S: somatic domain. The number (odds ratio) and thickness of the lines linking each domain and PSQI-related components reflect the effect sizes of associations. The co-occurring patterns are illustrated by participant groups. Panel (A): total participants. Panel (B): the poor sleep quality with high insomnia (PSQ+HI) group. Panel (C): the poor sleep quality with moderate insomnia (PSQ+MI) group. Panel (D): the poor sleep quality with low insomnia (PSQ+LI) group.