Figures & data
Table 1 Demographics and Characteristics of Total Sample (N = 66)
Table 2 Ordinal Regression Model Predicting Post-PVT Sleepiness Scores
Table 3 Correlations of Pre-PVT Sleepiness Score, Post-PVT Sleepiness Score, Changes in Sleepiness Score from Pre-to-Post PVT, Log-Transformed Signal-to-Noise Ratio with Person-Level Factors and PVT Performance Metrics
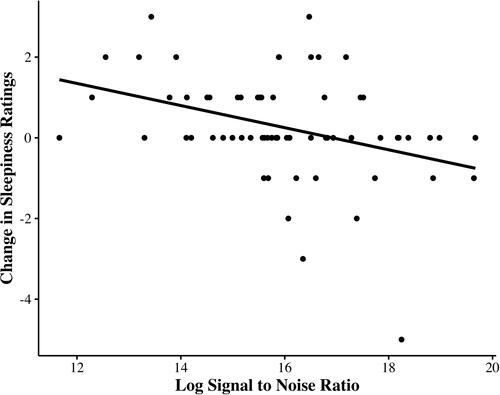
Figure 1 This figure depicts the scatter plot between the LSNR and pre-to-post changes in sleepiness. The correlation between LSNR and pre-to-post changes in sleepiness was significant (rs = −0.370, p < 0.01). Participants who had lower fidelity of information processing during the PVT reported greater sleepiness after completing the PVT than they had immediately before doing the PVT, whereas participants who had higher fidelity of information processing reported less sleepiness after the PVT, in individuals with and without insomnia symptoms. Removing the participant who appeared to have an extreme change in sleepiness ratings in the negative direction did not alter the pattern of results or significance level.