Figures & data
Table 1 Demographic and Clinical Data
Table 2 Respiratory Polygraphic Indices
Figure 1 Flow diagram of the study.
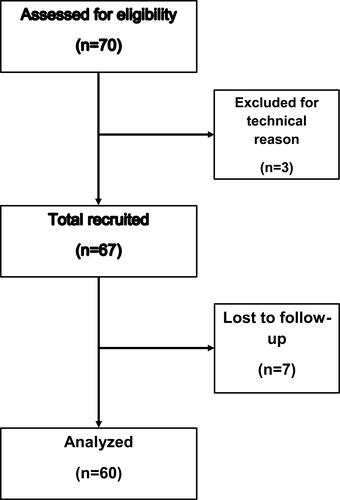
Table 3 Neurovegetative Data Categorized According to SDB Pattern and Presence/Absence of Arterial Hypertension at Baseline
Table 4 Neurovegetative Data Categorized According to SDB Pattern and Site of Ischemic Stroke at Baseline
Table 5 Sleep Data at Follow-Up Categorized According to Baseline SDB Pattern
Table 6 Sleep and Autonomic Data at Follow-Up for Each Group According to Site of Ischemic Stroke and SDB Pattern Observed in the Chronic Phase
Table 7 Individual Changes in SDB Patterns Between Baseline and Follow-Up
Figure 2 Changes in global (A), obstructive (B) and central AHI (C) between acute and chronic phases in the four groups of patients, separately for SDB pattern at baseline.
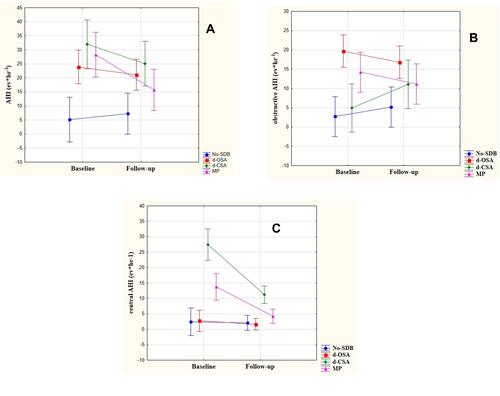
Figure 3 Modification over time of BRS evaluated according to the site of lesion and the pattern of SDB.

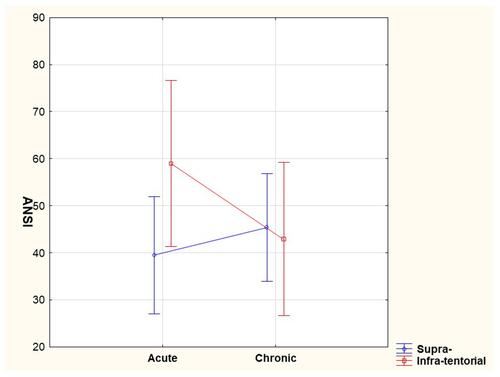
Figure 4 Trend of ANSI between acute and chronic phases according to site of ischemic lesion.