158
Views
2
CrossRef citations to date
0
Altmetric
Original Research

Emfit Bed Sensor Activity Shows Strong Agreement with Wrist Actigraphy for the Assessment of Sleep in the Home Setting

ORCID Icon, ORCID Icon, & ORCID Icon
Pages 1157-1166 | Published online: 16 Jul 2021

Figures & data

Table 1 Cohort Characteristics

Figure 1 Enrollment flow chart. *Consent obtained from a parent or legal guardian for all minors (5–17 years).

Figure 1 Enrollment flow chart. *Consent obtained from a parent or legal guardian for all minors (5–17 years).

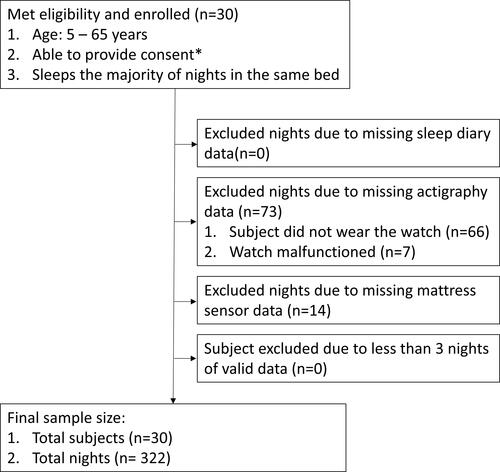
Table 2 Correlation of Sleep Parameters Recorded by Emfit Bed Sensor and Actigraphy

Figure 2 Synchronized movement data from actigraphy and bed sensor. Activity data for three different subjects, obtained with actigraphy (AC) and the bed sensor (BS). Light blue indicates the period between bed entry time and bed exit time. Dark blue indicates the period between sleep start and sleep end. Note how activity spikes (black) correlate between the two devices for all three subjects. Subjects 2 and 3 spend time between waking up (increase in activity noted by the two devices) and bed exit (noted by continuous activity on actigraphy and end of activity detected by the bed sensor).

Figure 2 Synchronized movement data from actigraphy and bed sensor. Activity data for three different subjects, obtained with actigraphy (AC) and the bed sensor (BS). Light blue indicates the period between bed entry time and bed exit time. Dark blue indicates the period between sleep start and sleep end. Note how activity spikes (black) correlate between the two devices for all three subjects. Subjects 2 and 3 spend time between waking up (increase in activity noted by the two devices) and bed exit (noted by continuous activity on actigraphy and end of activity detected by the bed sensor).

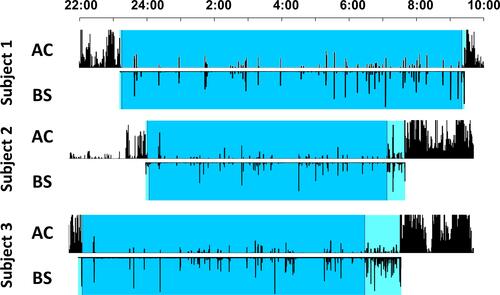
Table 3 Statistical Measures of Epoch-by-Epoch Comparisons Between Actigraphy and Emfita