Figures & data
Table 1 Demographic Characteristics of Actigraph Study Population
Table 2 Self-Reported Population Characteristics
Figure 1 Effect of personal risk factors on sleep quality. A total of 984 individuals completed the self-reported questionnaires to help investigate the influence of personal risk factors on sleep quality, as assessed by the PSQI score across: (A) BMI groups defined as: lean (BMI < 25), overweight (BMI = 25–29.9) and obese (BMI ≥ 30); (B) Age groups; (C) Sex/gender; and (D) Job type (desk job/ non-desk job). All data are expressed as the mean ± SD. Statistical analysis was performed using one-way ANOVA (Tukey’s multiple comparisons test). Pearson’s correlation analysis was conducted between the global PSQI score and (E) BMI (kg/m2) or (F) Age (years). Each dot represents an individual value. **P < 0.01 was considered highly significant, and ****P< 0.0001 were considered extremely significant, ns was indicated as non-significant.
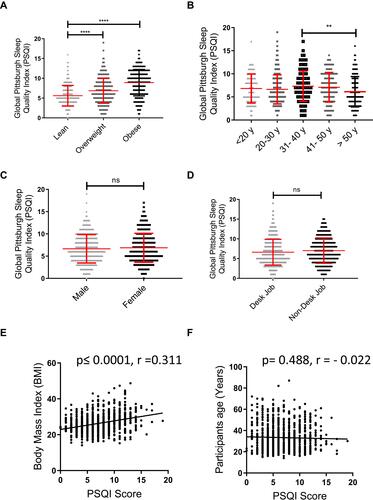
Table 3 Correlation Between BMI and PSQI Components
Figure 2 Effect of obesity on sleep duration. Participants were divided into three groups as: lean (BMI < 25), overweight (BMI = 25–29.9) and obese (BMI ≥ 30). (A) Self-reported sleep duration was compared between all three groups. (B) Pearson’s correlation analysis was conducted between self-reported sleep duration and the BMI of each individual. All data are expressed as the mean ± SD. Statistical analysis was performed using one-way ANOVA (Tukey’s multiple comparisons test). **P < 0.01 was considered highly significant, and ****P < 0.0001 were considered extremely significant.
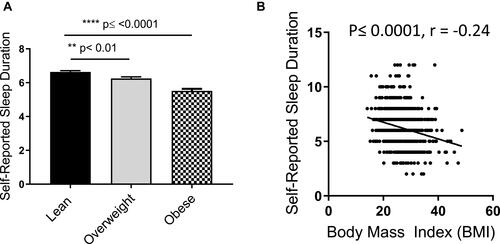
Table 4 Multiple Linear Regression Analysis of Obesity Risk Factors Vs BMI
Table 5 Actigraphy Data
Table 6 Multiple Linear Regression Analysis of Sleep Parameters Vs BMI
Table 7 Multiple Linear Regression Analysis of Sleep Parameters vs TST
Figure 3 Objectively measured sleep analysis and its influence on BMI. A total of 60 participants had their sleep pattern monitored for 7 consecutive days through the use of Actigraph worn on the right hip. Participants were divided into three groups according to their BMI levels as before and their sleep efficiency and its components were compared in three BMI groups (lean, overweight, and obese). (A) total efficiency of sleep, (B) total time in bed, (C) total sleep time, (D) wake after sleep onset, (E) average number of awakening and (F) Average awakening duration. All data are expressed as the mean ± SD. Statistical analysis was performed using one-way ANOVA (Tukey’s multiple comparisons test). *P < 0.05 was considered statistically significant, **P < 0.01 was considered highly significant, and ***/****P < 0.001/P < 0.0001 were considered extremely significant.
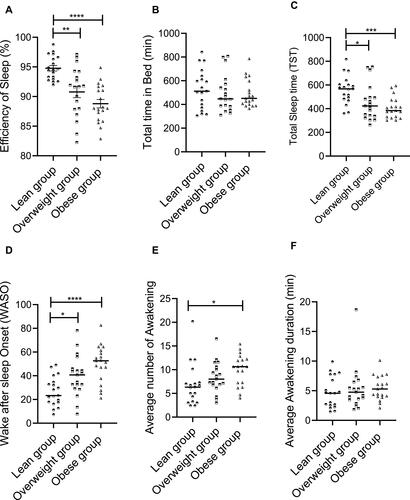
Figure 4 Correlation between sleep components and BMI. A total of 60 participants had their sleep pattern monitored for 7 consecutive days using Actigraphy. Participants were divided into three groups according to their BMI levels as lean (BMI ˂ 25 kg/m2), overweight (BMI = 25–29.9 kg/m2), and those with obesity (BMI ≥ 30 kg/m2), 20 each. Pearson’s correlation analysis was conducted between (A) efficiency of sleep, (B) total sleep time, (C) wake after sleep onset, and (D) number of awakening per night and the BMI of each individual. All data are expressed as the mean ± SD. Statistical analysis was performed using one-way ANOVA (Tukey’s multiple comparisons test).
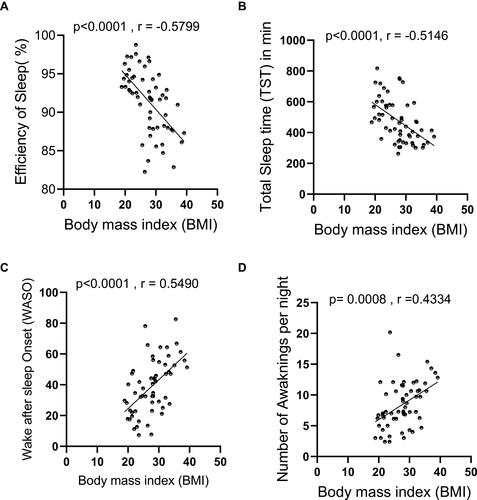
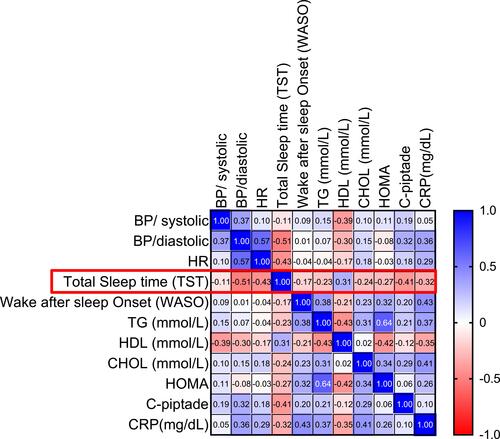
Figure 5 Correlation between sleep components and metabolic syndrome risk factors. A total of 60 participants had their sleep pattern monitored for 7 consecutive days using Actigraphy. Pearson’s correlation analysis is presented as heatmap showing the correlations of total sleep time (TST) and wake after sleep onset (WASO) with the known risk factors for metabolic syndrome. Darker shading indicates a greater degree of correlation, and correlations with p-values > 0.05 are displayed in white.