
Figures & data
Figure 1 Comparison of the distribution of LM intermovement intervals during sleep in patients with OSA and with or without PLMS. This figure has been redrawn based on data reported by Manconi et al in 2014.Citation6
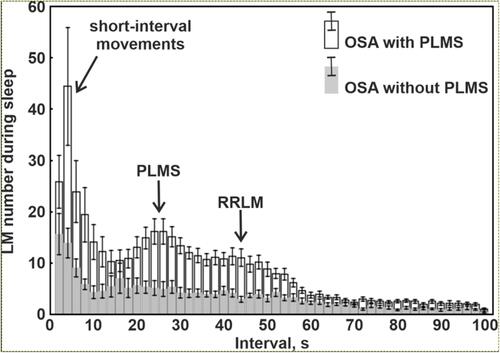
Figure 1 Comparison of the distribution of LM intermovement intervals during sleep in patients with OSA and with or without PLMS. This figure has been redrawn based on data reported by Manconi et al in 2014.Citation6