Figures & data
Table 1 Demographic Characteristics, Sleep Parameters, and Cognitive Function Test Results of the Participants
Table 2 Brain Regions That Showed Significant Group Differences in Cerebral Blood Flow
Figure 1 Brain regions that showed lower absolute cerebral blood flow in the FF group than in the control group are displayed in the axial, sagittal and coronal sections. Whole brain voxel-wise analyses were performed after adjusting for age and global mean cerebral blood flow of the grey matter. The color bar represents voxel-level t values. The numbers below the brain slices indicate z, x, y coordinates in the Montreal Neurological Institute space.
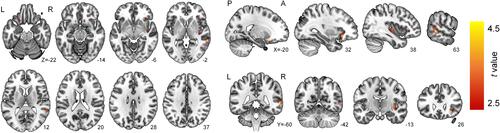
Figure 2 Relationship between sleep efficiency (left panels), wake after sleep onset (WASO) (right panels) and cerebral blood flow (CBF) of the significant three clusters. Mean sleep efficiency for 7 days, as measured by wrist-worn actigraphy, has a positive linear association with the CBF of the cluster 2 that is located in the right orbitofrontal cortex (β = 0.21, p = 0.002). Mean WASO for 7 days, also measured by wrist-worn actigraphy, has a negative linear association with the CBF of the clusters 2 (β = −0.22, p = 0.001) and 3 (β = −0.18, p = 0.012), which are located in the right orbitofrontal and insular cortices, respectively. A regression line and beta coefficients are from the multivariate regression model including the following variables: the CBF values extracted from each cluster as the dependent variables; sleep efficiency or WASO as an independent variable; age, sex, and mean global CBF as covariates. The CBF of each cluster is displayed in the values adjusted for age, sex, and mean global CBF. *p < 0.013.
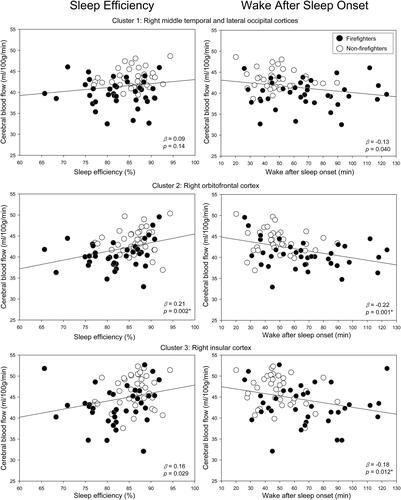
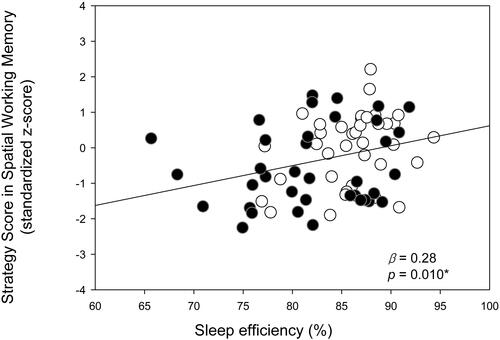
Figure 3 Relationship between the sleep efficiency and performance in the Spatial Working Memory (SWM) task of the CANTAB. Higher sleep efficiency showed a positive linear association with the higher strategy score of the SWM (β = 0.28, p = 0.010). A regression line and beta coefficients are from the regression model including the following variables: The strategy score of SWM as the dependent variable; sleep efficiency as an independent variable; age, sex, and education level as covariates. *p < 0.013.