Figures & data
Table 1 Differences in Demographic Characteristics, BP, Chronotype and TP Between Pre- and Post-COVID-19 Outbreak Groups
Table 2 Correlations Between BP, Demographic Characteristics, Chronotype and TP in Pre- and Post-COVID-19 Outbreak Groups, Respectively
Table 3 Hierarchical Regression Analyses Exploring the Effects of Chronotype and TP on BP in Pre- and Post-COVID-19 Outbreak Groups, Respectively
Table 4 Unstandardized Direct, Indirect and Total Effects of SEM Models in Pre- and Post-COVID-19 Outbreak Groups, Respectively
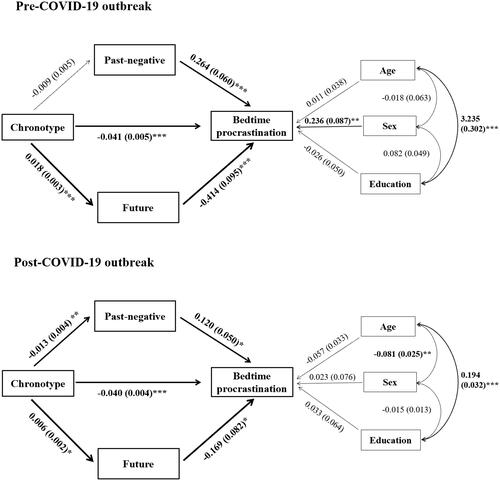
Figure 1 The results of structural equation modeling of the mediating roles of TPs in the association between BP and chronotype in pre- and post-COVID-19 outbreak samples. The effect of demographic characteristics (sex, age, and years of education) on BP was controlled in these models. All the coefficients in the figure are unstandardized. The model fit indices in the pre-COVID-19 outbreak sample: χ2/df = 1.743, p = 0.065, RMSEA = 0.053, GFI = 0.982, CFI = 0.987, NFI = 0.970, TLI = 0.972, IFI = 0.987. The model fit indices in the post-COVID-19 outbreak sample: χ2/df = 1.113, p = 0.347, RMSEA = 0.018, GFI = 0.991, CFI = 0.994, NFI = 0.946, TLI = 0.987, IFI = 0.994. *p < 0.05, **p < 0.01, ***p < 0.001.