
Figures & data
Table 1 Sociodemographic Characteristics and COVID-19-Related Characteristics (N = 588)
Table 2 Differences Between Groups on Sleep Quality and Perceived Stress
Table 3 Frequency of Each Score on the GAD-2 and the PHQ-2 (N = 588)
Table 4 Comparisons Between Anxiety and Non-Anxiety Symptom as Well as Depression and Non-Depression Symptom Individuals
Figure 1 Final structural model (N = 588).
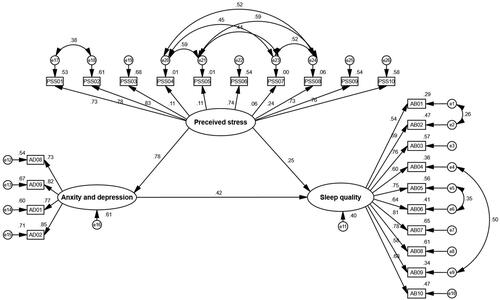
Table 5 Evaluation of the Goodness-of-Fit of the Model (N = 588)