Figures & data
Figure 1 Inclusion and exclusion criteria for the study population. This figure depicts the inclusion of patients into the current investigation as a flowchart. The arrows that branch off represent patients that did not meet the criteria and were excluded.
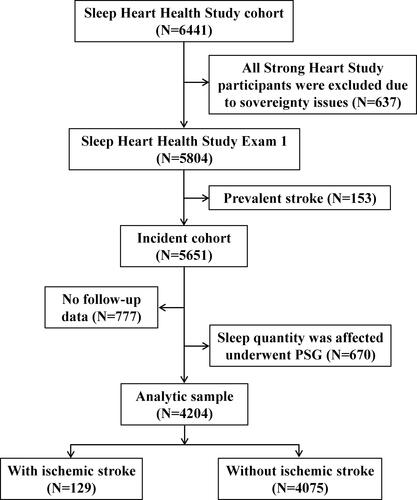
Table 1 Descriptive Characteristics by WASO Quartile (Quartile I: <30.0min; Quartile II: 30.0min–48.5min; Quartile III:49.0min-80.0min; Quartile IV: >80.0min)
Table 2 HRs and 95% CIs for Sleep Characteristics Associated with Ischemic Stroke
Table 3 HRs and 95% CIs for Quartiles of WASO and SE Associated with Ischemic Stroke
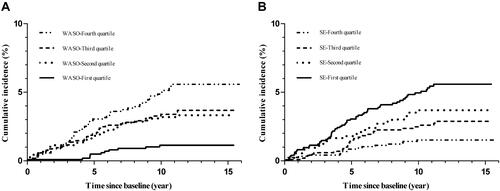
Figure 2 Kaplan-Meier plots of cumulative risk for ischemic stroke stratified by WASO quartiles ((A); quartile I <30.0 min; quartile II: 30.0 min-48.5 min; quartile III: 49.0 min-80.0 min; quartile IV: >80.0 min) and SE ((B); quartile I <80%, quartile II: 80%-84.9%, quartile III: 85%-89.9%, and quartile IV: ≥90%).