
Figures & data
Figure 1 Continued.
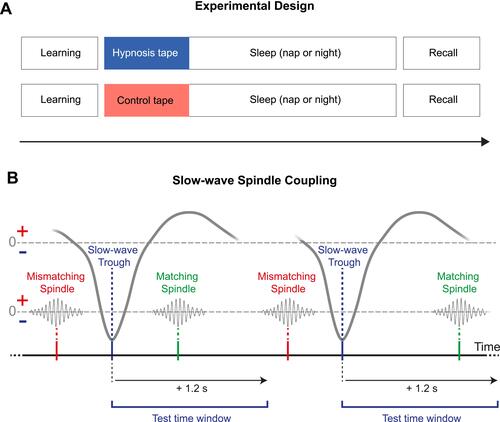
Figure 1 Experimental procedure and analysis of sleep-oscillations. (A) Thirty-three high hypnotizable subjects listened to a hypnosis (blue) or a control tape (red) while falling asleep according to a within-subject design. In both sessions participants either slept during a midday nap (90 min) or during the night (8h). Learning of a declarative paired associate learning task (PAL) was conducted before sleep and the recall of the same task after sleep. Analyses of slow-waves, sleep spindles and their coupling were conducted using the open-source SpiSOP tool (www.spisop.org; RRID: SCR_015673). (B) Coupling analyses were performed within the time window starting with the trough of the slow-wave until 1.2 s after this trough for slow and fast spindles. We identified coupling events where at least one detected sleep spindle trough (maximum negative amplitude) was detected within the specified time window. As a result, the number of matches and the percentage of matches relative to the total amount of slow-waves were calculated for each participant and lobe (frontal slow spindles, parietal fast spindles) during NREM sleep. (C) For detection of slow-waves, the signal was initially filtered between 0.3 and 3.5 Hz in each channel during NREM sleep. Second, all intervals with consecutive positive-to-negative zero crossings (down – up – down) were marked as putative slow-waves. They were only kept for further analyses, if their durations matched with a frequency between 0.5–1.11 Hz, while down-zero-crossings marked the begin and end of a slow-wave. Possible matches were considered as artifacts and excluded if their amplitude exceeded 1000 µV, or if both negative and positive half-wave amplitudes lay between –15 and +10 µV. Finally, a slow-wave was identified if the following two criteria were met: the negative half-wave peak potential (ptrough) was lower than 1.25 × the mean negative half-wave peak of all allegedly detected slow-waves within the respective EEG channel (Threshold 1); the amplitude (trough to peak) was larger than 1.25 × the mean amplitude of all other allegedly detected slow-waves within this channel (Threshold 2). As a result, number of slow-waves, density per 30s epoch NREM sleep, mean amplitude, duration, down slope (value of the negative half-wave peak divided by the time from the first zero-crossing to the trough in µV/s) and up slope (absolute value of the negative half-wave peak divided by the time from the trough to the next zero-crossing in µV/s) were calculated for each participant and channel during NREM sleep. (D) For the detection of sleep spindles, the EEG signal of each channel during NREM sleep was filtered with the frequency determined by an individual slow- and fast spindle power peak ± 1 Hz. Next, the root mean square (RMS) signal was computed using a sliding window with a size of 0.2 s and the resulting signal was smoothed in the same window with a moving average. A spindle was detected when the smoothed RMS signal exceeded an individual amplitude threshold by 1.5 standard deviations (SD) of the filtered channel signal for 0.5 to 3 s at least once. The threshold crossings marked the beginning and end of each spindle event and determined their duration. Amplitude of sleep spindles was defined by the voltage difference between the largest trough and peak (peak to trough potential). Spindles with an amplitude above 200 µV were excluded. Analysis resulted in data of the number of detected spindles, spindle density (per 30s NREM sleep epoch), mean amplitude (trough to peak potential), average oscillatory frequency (Avg. Frequency using number of peaks (#peaks) and number of troughs (#troughs)) and duration for each participant and channel (frontal slow spindles, parietal fast spindles) during NREM sleep. (B–D) Figures were retrieved from www.spisop.org/documentation/ and adapted with permission from the copyright owner (Frederik D. Weber).
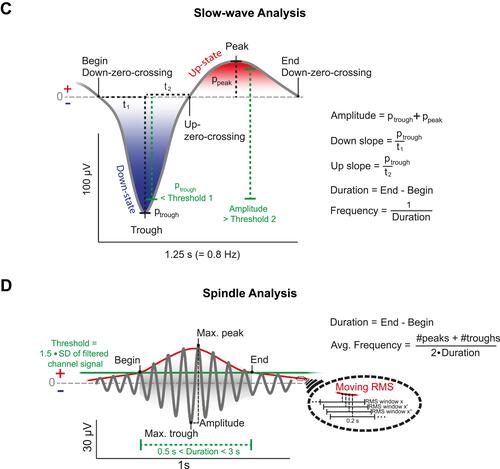
Figure 2 Results of coupling, slow-wave and spindle analysis. Data are shown separately for the control (red bars) and the hypnosis condition (blue bars). (A and B) Here provided are the percentages of matches between slow-waves and spindles relative to the total amount of slow-waves in NREM sleep. Listening to a hypnotic suggestion to sleep more deeply reduced (A) coupling of frontal slow-waves and slow spindles and (B) coupling of parietal slow-waves and fast spindles compared with a control tape. Listening to a hypnotic suggestion to sleep more deeply increased (C) frontal as well as (D) parietal slow-wave density per 30s epoch of NREM sleep compared with a control tape. Listening to a hypnotic suggestion to sleep more deeply did neither affect (E) frontal slow spindle nor (F) parietal fast-spindle density per 30s epoch of NREM sleep compared with a control tape. Values are displayed as mean ± SEM. **p < 0.01, *p < 0.05.
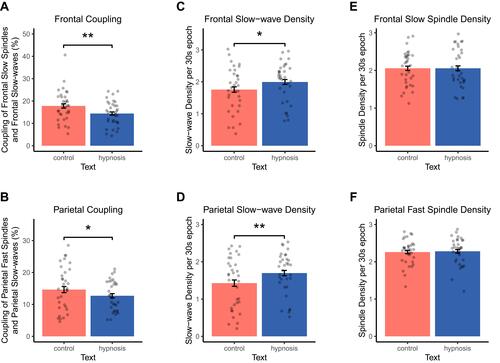
Table 1 Coupling, Slow-Wave and Spindle Parameters in the Hypnosis and Control Session for the Nap and Night Study