
Figures & data
Figure 1 Flow chart.
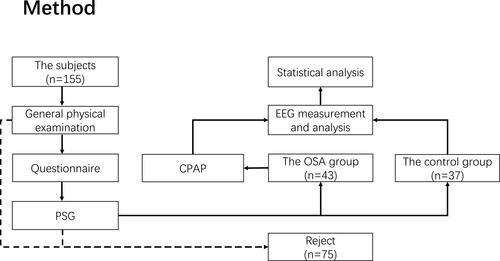
Table 1 Demographic Data, PSG Parameters, and Questionnaires of All Participants
Table 2 PSG Parameters of the OSA Group Before and After CPAP Treatment
Table 3 Absolute Power of Each Frequency Band of EEG in the OSA Group or Control Group (μV2)
Table 4 DAR and TSR on Different Channels of EEG in the OSA Group and Control Group
Figure 2 Quantitative analysis of absolute powers of channel C3 in the first three NREM-REM sleep cycles in the OSA group and control group (A-F).
Notes: N11 refers to the N1 period in the first sleep cycle, N21 refers to the N2 period in the first sleep cycle, N12 refers to the N1 period in the second sleep cycle, and so on. Because the number of sleep cycles for each subject was not equal, only the data of the first three sleep cycles were counted.
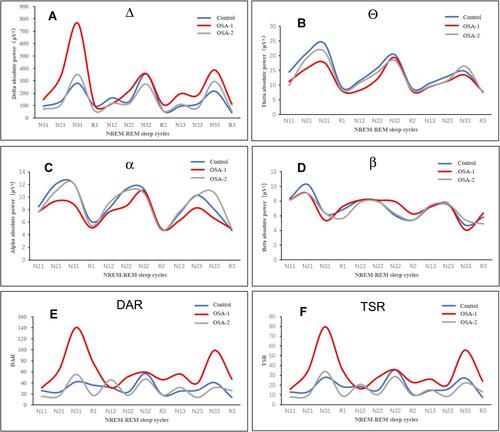
Table 5 Questionnaire Score Correlations with PSG and EEG Parameters