Figures & data
Figure 1 Visceral (VAT) and subcutaneous (SAT) adipose tissue depots. (A) Subcutaneous and visceral adipose tissue depots in the abdomen. (B) Pathologic/inflamed visceral adipose tissue.
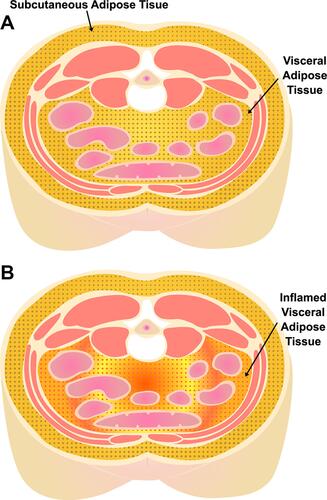
Figure 2 Adipose tissue manual tracing and segmentation. (A) Axial MR slice, with manual tracing of the outer contours of subcutaneous adipose tissue (SAT), performed for each slice from the pelvic floor to the level of the diaphragm. (B) Fat segmentation using a custom-made MATLAB script to perform automated analysis of pixel intensity to discriminate tissue class (visceral adipose tissue [VAT] in the abdomen from other organs). Adipose tissue areas from each slice were then summed across the abdomen for total SAT and VAT volumes. (C) Adipose tissue FDG uptake was measured using standardized uptake values (SUV) within the segmented VAT and SAT compartments of each analyzed slice, excluding organ (renal) FDG uptake.
![Figure 2 Adipose tissue manual tracing and segmentation. (A) Axial MR slice, with manual tracing of the outer contours of subcutaneous adipose tissue (SAT), performed for each slice from the pelvic floor to the level of the diaphragm. (B) Fat segmentation using a custom-made MATLAB script to perform automated analysis of pixel intensity to discriminate tissue class (visceral adipose tissue [VAT] in the abdomen from other organs). Adipose tissue areas from each slice were then summed across the abdomen for total SAT and VAT volumes. (C) Adipose tissue FDG uptake was measured using standardized uptake values (SUV) within the segmented VAT and SAT compartments of each analyzed slice, excluding organ (renal) FDG uptake.](/cms/asset/184c5a85-53aa-4c38-a641-4351ec17ee33/dnss_a_12174239_f0002_c.jpg)
Table 1 Patient Demographics and Outcome Measures by Sleep Apnea Severity
Table 2 Multivariable Linear Regression – VAT Inflammation and Sleep Apnea Severity (Continuous)
Table 3 Change in Outcomes by CPAP Adherence
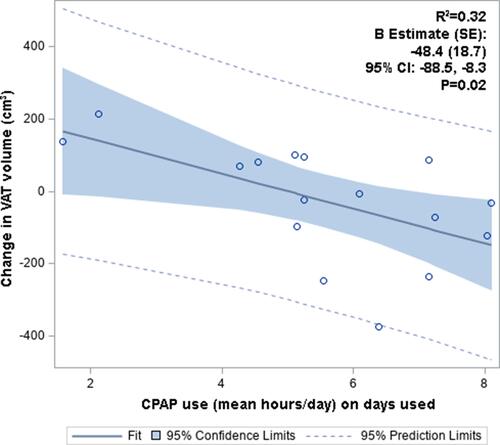
Figure 3 Change in VAT volume vs CPAP adherence (mean hours/day). Change in VAT volume was inversely correlated with CPAP adherence.