Figures & data
Figure 1 The epiglottic length (from the free edge to the base of the epiglottis) and the epiglottic angle (the angle between the long axis of the epiglottis and the vertical plane) are measured using ImageJ software.
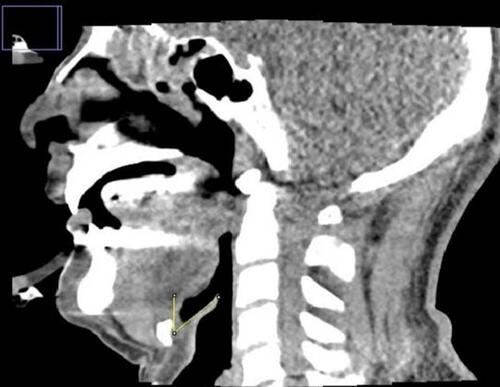
Figure 2 Images of the midsagittal view from drug-induced sleep computed tomography were collected and categorized into (A) epiglottic collapse (attach to the posterior pharyngeal wall) and (B) non-epiglottic collapse.
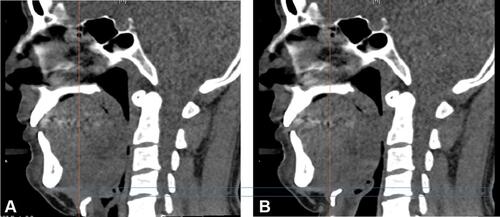
Figure 3 Endoscopic classification for collapsibility of epiglottis. (A) Type I, the whole glottis is visible; (B) Type II, only the posterior glottis is visible; (C) Type III, the glottis is obscured by the epiglottis.
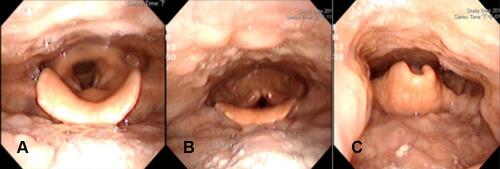
Table 1 Demographics
Figure 4 (A) A longer epiglottis length is prone to epiglottic collapse during drug-induced sleep computed tomography (21.2 vs 15.8 mm; p < 0.001). (B) No statistical significance is found in the angle of epiglottis (38.6° vs 36.2°; p = 0.41) between epiglottic collapse and non-epiglottic collapse patients.
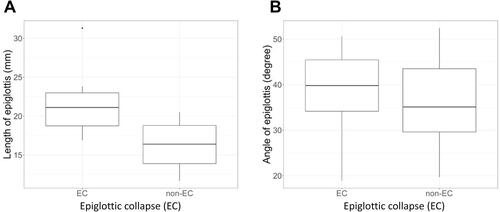
Figure 5 The cutoff value of the length of the epiglottis is 16.6 mm (sensitivity, 100%; specificity, 65.22%; Youden index: 0.65; area under the ROC curve: 0.88; p < 0.0001).
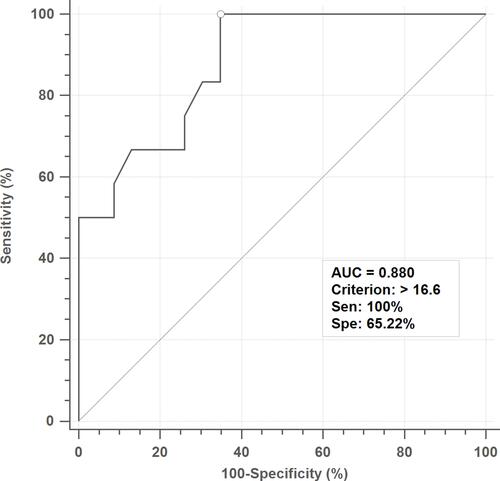
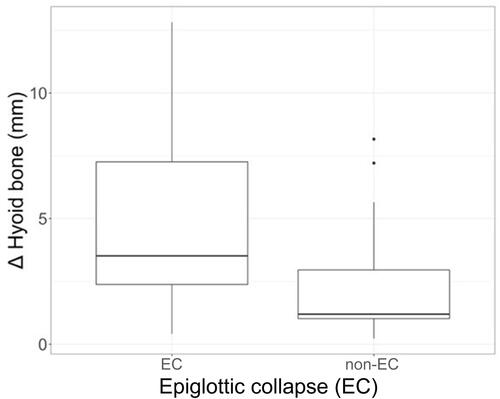
Figure 6 A significantly higher hyoid bone movement is seen in patients with epiglottic collapse than non-epiglottic collapse in drug-induced sleep computed tomography (4.8 vs 3.0 mm; p = 0.027).