Figures & data
Figure 1 Study protocol. Black horizontal bars represent sleep opportunities; grey horizontal bars represent simulated 12-hour night-shifts; and black circles represent assessments of neurobehavioural performance and self-perceived capacity. “X” represents entry to, and exit from, the laboratory. “M” represents meals.
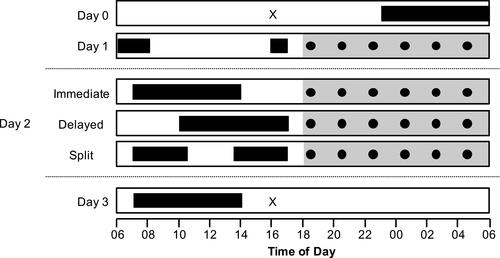
Table 1 Sleep Parameters Derived from Polysomnography for the Immediate, Delayed and Split Conditions
Figure 2 Sleep histograms representing the probability distribution of sleep stages in the immediate (top panel), split (middle panel) and delayed (bottom panel) conditions. Data represent the percentage of epochs scored as Stage N1 and Stage N2 sleep (light grey bars), Stage N3 sleep (white bars) and Stage R sleep (dark grey bars) in 5-min bins.
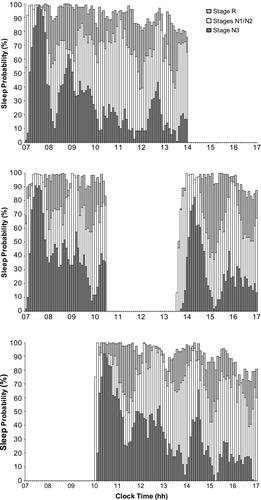
Figure 3 PVT reciprocal response time (top left panel), PVT lapses (top right panel), SAS reciprocal response time (middle left panel), SAS percentage of correct responses (middle right panel), DSST total substitutions attempted (bottom left panel) and DSST percentage of correct responses (bottom right panel) for each test session in the immediate (open circles), split (open triangles) and delayed (closed squares) conditions. Data are mean (± SEM).
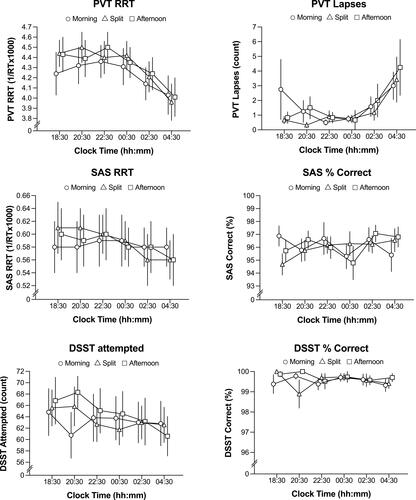
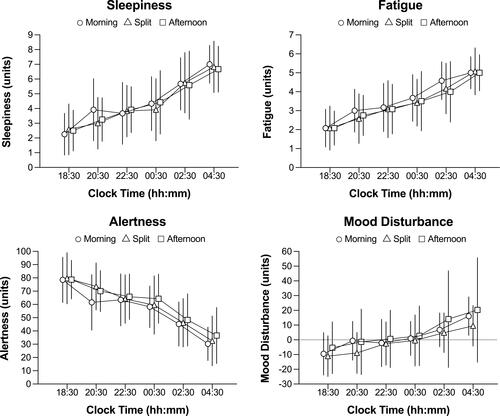
Figure 4 Karolinska Sleepiness Scale (top left panel), Samn-Perelli fatigue scale (top right panel), VAS alertness (bottom left panel) and total mood disturbance (bottom right panel) for each test session in the immediate (open circles), split (open triangles) and delayed (closed squares) conditions. Data are mean (± SEM).